The U.S. hotel industry reemerged from the Halloween-induced slowdown with occupancy increasing to 64.8%, up 5.2 percentage points from the prior week and half a percentage point year over year.
Average daily rate increased 4% year over year, restarting the 3%-plus growth streak that halted the previous week. Prior to that decline, ADR had grown 3% or more for six straight weeks. Revenue per available room improved 4.9% year over year, which represented the largest weekly increase since early October.
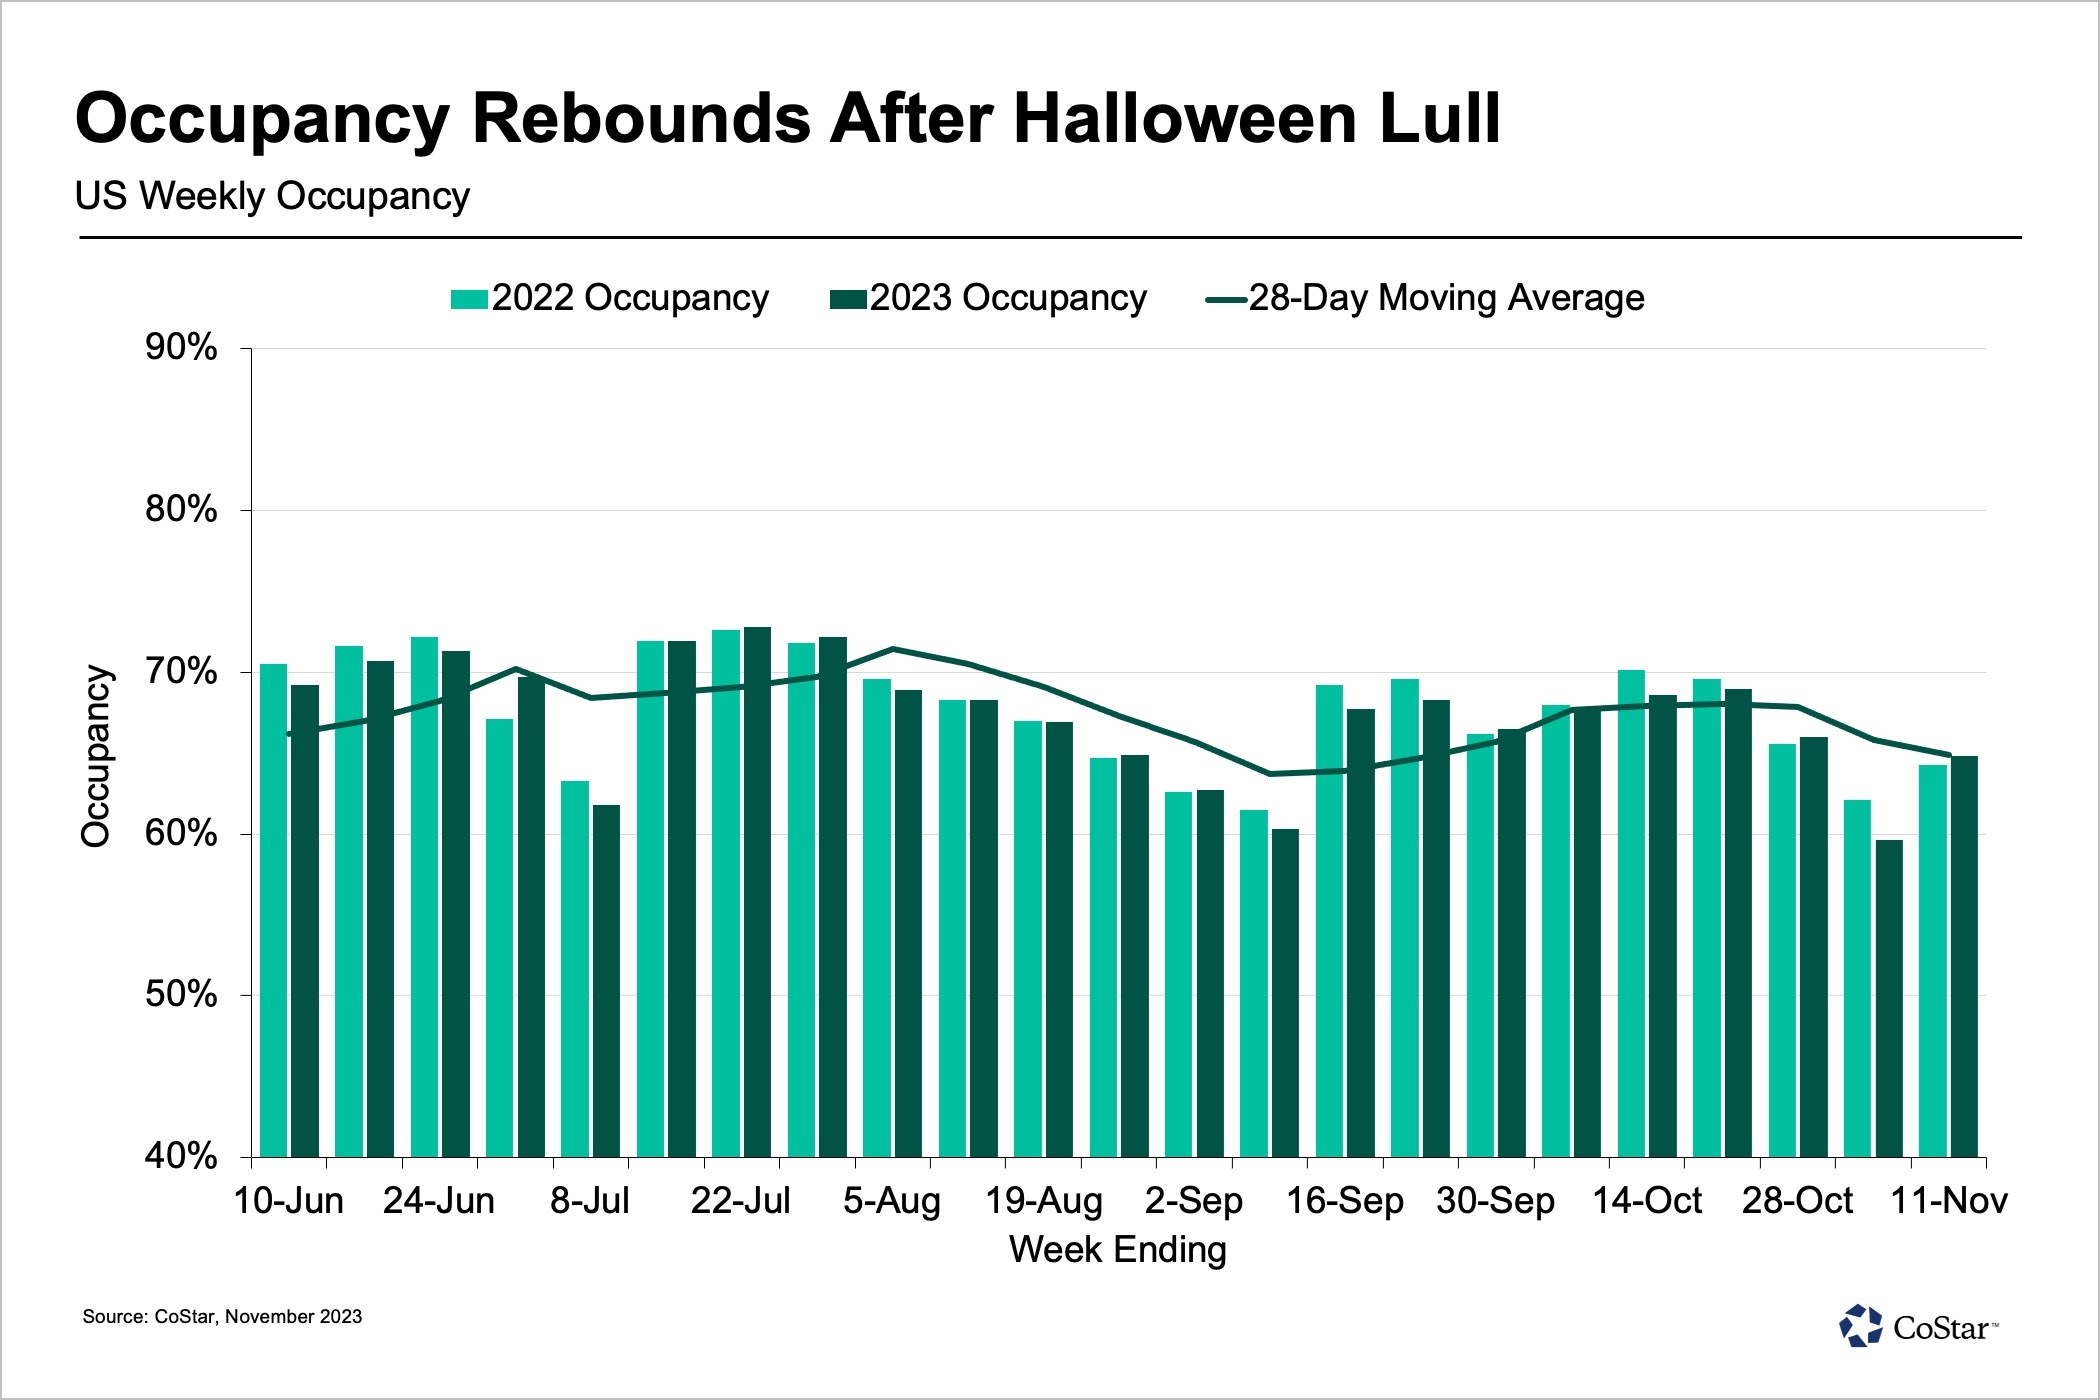
Weekday (Monday to Wednesday) travel, likely business and group demand, was largely responsible for the week’s strong performance. Midweek RevPAR increased 9.2% year over year, the second-largest increase for that day type since early May, thanks to occupancy increasing 2.1 percentage points to 64.9% and ADR rising 5.6%. Shoulder days (Sunday and Thursday) also showed RevPAR growth of 3.8%, driven by ADR growth of 4.1%. Weekend RevPAR was essentially flat, up 0.9%, due to an occupancy decline of 1.1% and modest ADR growth of 2.4%. Despite the drop, weekend occupancy remained above 70% for an 11th consecutive week.
The top 25 markets took the week’s improved performance to the next level with weekday RevPAR up 11.9%, the second-largest RevPAR gain since early July. That gain came as occupancy increased 3.5 percentage points to 72.9% and ADR grew 6.5%. Shoulder RevPAR followed, increasing 6.7% with ADR up 4.9% and occupancy up 1.1 percentage points. Weekends were soft with RevPAR up 2.9%, driven by a 1-percentage-point gain in occupancy and a 1.6% increase in ADR. Weekend occupancy returned to a level above 80% after two weeks in the mid-70s.
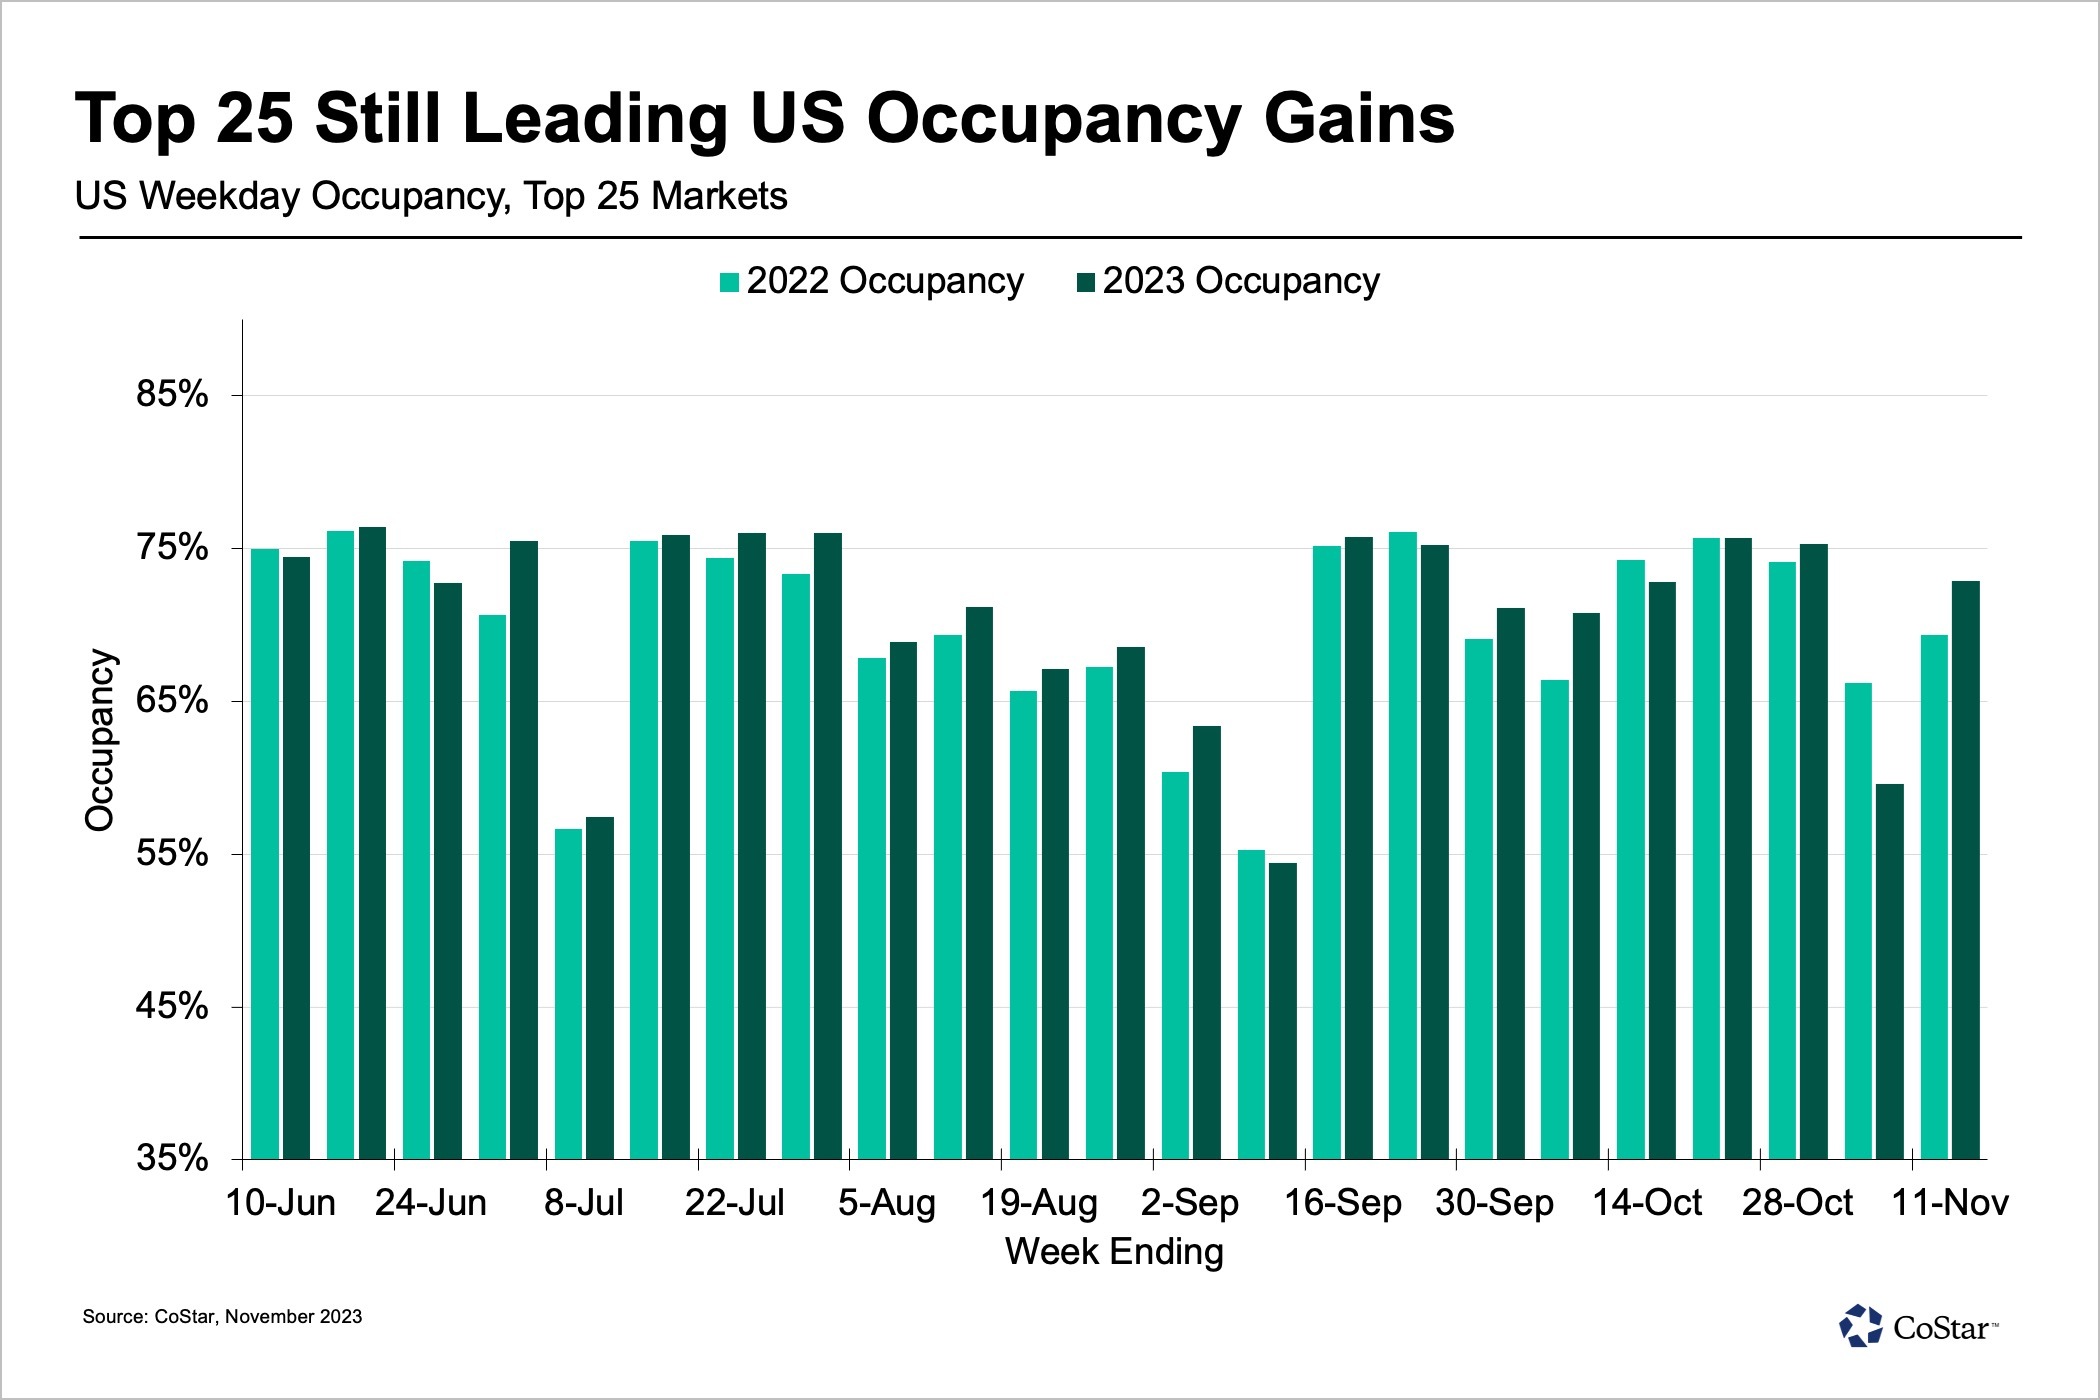
Every top 25 market saw weekday RevPAR gains except Atlanta, New Orleans and San Diego. The two markets posting the largest weekday RevPAR gains were Las Vegas, up 27.1%, and Dallas, up 24.7%. Overall, 13 of the top 25 markets reported double-digit weekday RevPAR growth.
The rest of the country followed a similar pattern to the top 25 markets but at a more subdued level. ADR was the main driver of weekday RevPAR, which increased 6.7%. RevPAR on shoulder days was up 1%, while the weekend fell 0.8% due an occupancy decline of 2.2 percentage points. What's more, weekend demand was down the most in the 50 largest markets based on supply, after the top 25. Those markets saw weekend demand decrease 3.4% year over year versus the remaining 92 markets, where weekend demand fell 1.9%. Some of the largest individual swings were in college football markets, where year-over-year game schedule shifts matter. However, 78% of those 50 markets saw weekend demand fall versus just over half of the remaining ones.
The weekend demand drop was due mostly to economy hotels, which were responsible for more than half of the decrease in the next 50 markets. Among the remaining markets, 63% of the weekend decline came from economy hotels. Interestingly, weekend demand was down in all types of hotels in the remaining markets, while luxury and upper-upscale hotels in the next 50 markets saw rising weekend demand.
Conventions and conferences also helped boost performance, evidenced by group demand among luxury and upper-upscale hotels increasing 8.7% year over year and 27.4% from the previous week. Year over year, group occupancy increased 1.7 percentage points with the top 25 markets again showing the largest impact on performance. Group occupancy increased 2.5 percentage points, while group occupancy for the rest of the country increased 0.7 percentage points.

Given the strength of groups, it’s not surprising that weekday RevPAR increased in the double-digits for upper-upscale (+13.4%) and upscale (+11.3%) hotels, with luxury RevPAR up 9%. Weekends and shoulder periods also produced strong performance for the top three hotel chains scales. Upper-midscale hotels posted respectable weekday performance, with RevPAR gains of 6.2%, while weekends and shoulder periods were flat. Midscale hotels experienced flat weekday RevPAR and negative RevPAR change for the other two periods. Economy hotels decreased for the weekday period as well as weekends and shoulder periods.
Global Performance
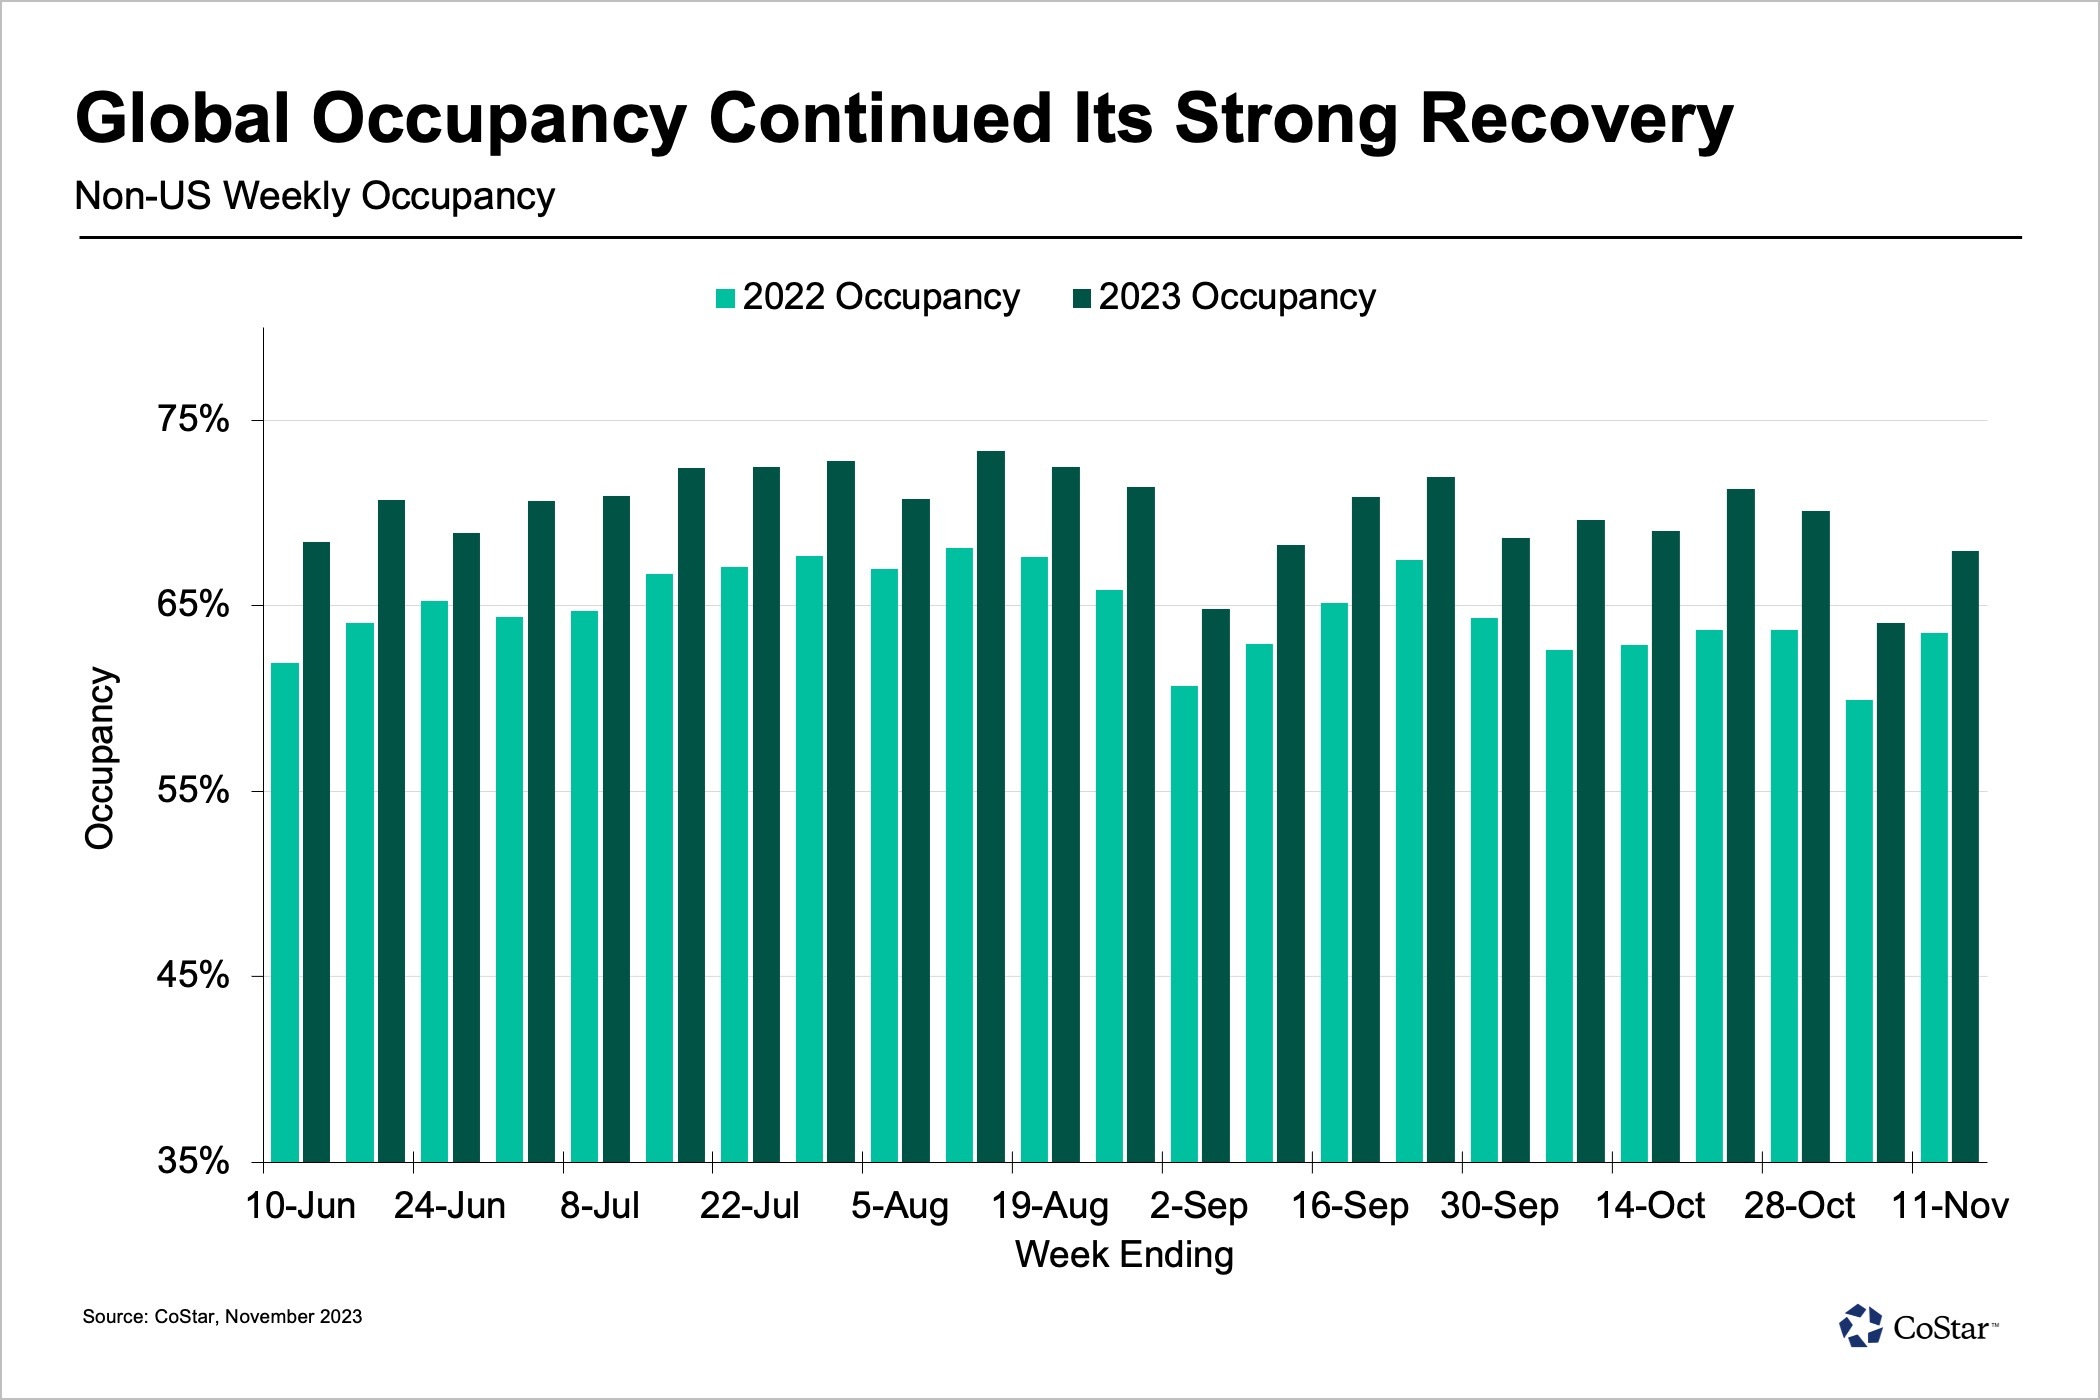
Global occupancy, excluding the U.S., also improved following a year-over-year decline the week before. Occupancy increased 3.9 percentage points week over week to 68%. Year over year, occupancy also continued to improve at a much faster rate than the U.S., increasing 7 percentage points compared to the same week last year. Weekly global ADR increased 10% year over year, keeping RevPAR growth in double figures at 17.6%.
RevPAR among the top 10 countries based on supply increased 24.2% year over year on an 11.1% gain on ADR. Occupancy rose 7.4 percentage points. Every country saw RevPAR growth except Mexico, which declined on falling ADR. Five of the top 10 — China, Japan, Spain, Germany and Indonesia — reported double-digit increases, with most of those countries seeing equal gains in both occupancy and ADR. Japan and Spain were the exception as ADR accounted for most of the RevPAR growth.
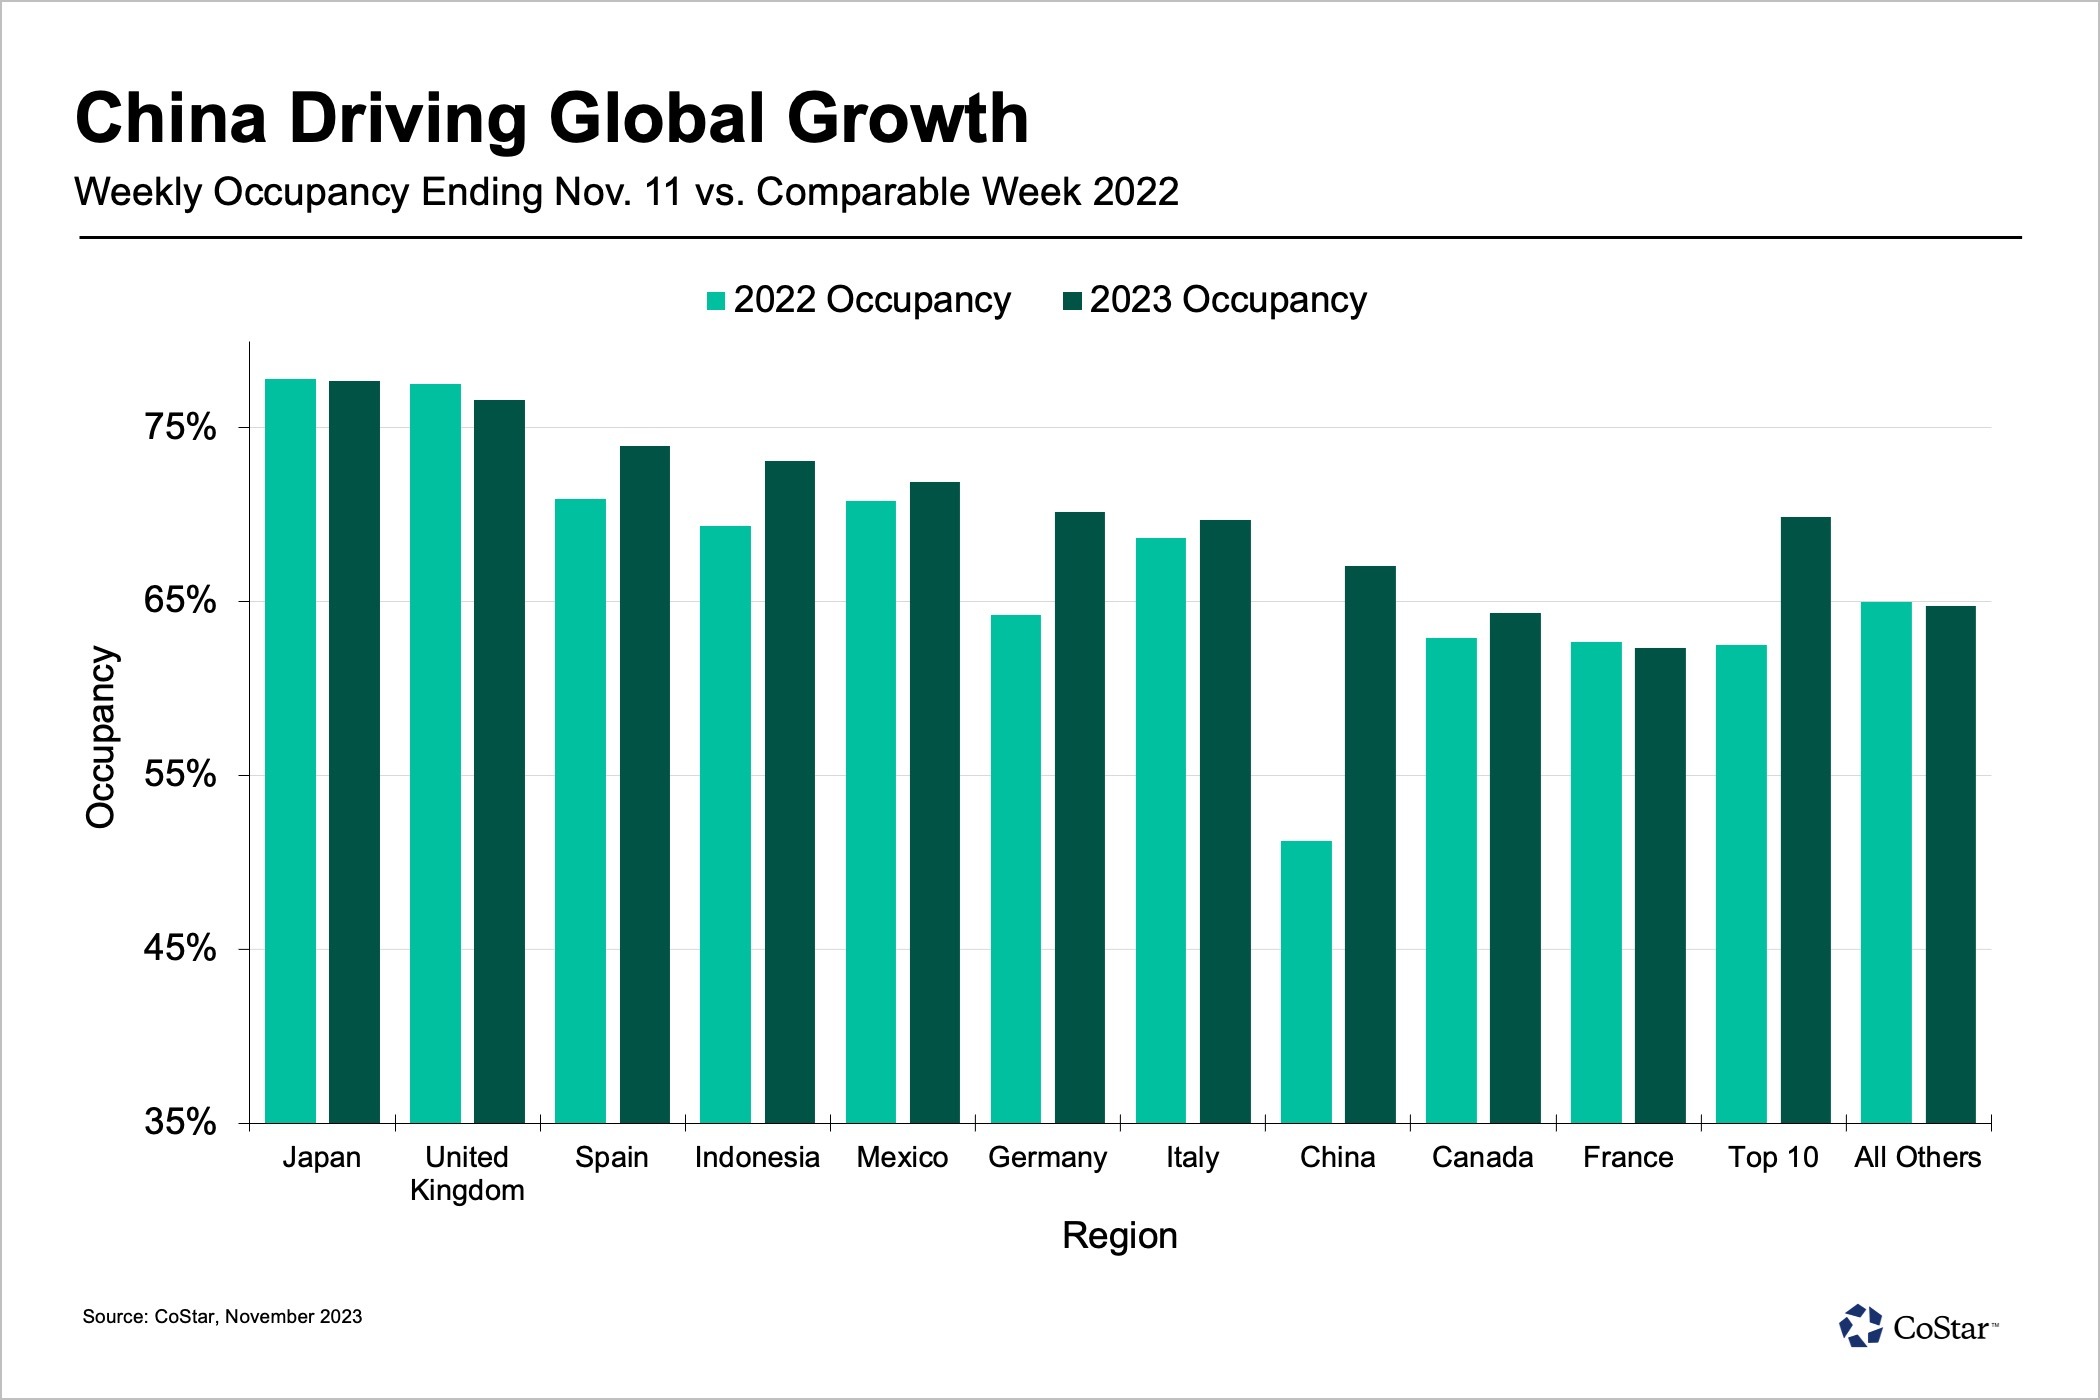
For the past six weeks, China has contributed an average of five percentage points to the growth in global RevPAR via rising occupancy. This week, China’s occupancy increased by 15 percentage points with ADR gaining 23.3% and resulting in 61.3% RevPAR growth. While its ADR growth was impressive, global ADR growth rises when China is excluded.
RevPAR in Mexico has fallen for more than 20 weeks, mostly on decreasing ADR. Most of the ADR decrease is coming from Mexican Caribbean hotels, which have seen steep decreases since April. Over the past three weeks, the declines have lessened from double digits to 1% this most recent week. We believe this is also due to the rebalancing of the industry as high-income travelers have taken their stays to other parts of the world that were inaccessible during the pandemic.
Outside of the top 10, performance was led by these countries:
- Americas: El Salvador, 84.5% (+12.2 percentage points year over year), which also posted the highest occupancy of any country in the world.
- Asia-Pacific: French Polynesia, 81.1% (+1.5 percentage points year over year).
- Europe: Serbia, 80.6% (+7.5 percentage points year over year).
- Middle East & Africa: United Arab Emirates, 83.4% (+1.5 percentage points year over year).
Final Thoughts
The story we have shared throughout the year has become somewhat repetitive as the industry returns to normal. Business travel continues to grow, conventions and conferences are strong, the U.S. top 25 markets are recovering, and leisure travel is resuming seasonal patterns. Hotels in the higher tiers are also posting the strongest performance given they were the last to recover and tend to be in the top 25 markets. While the news is not riveting reading, it is important to share the news that our industry is stabilizing and is expected to continue at a normal pace for the rest of the year and into 2024.
Looking Ahead
In the week ending Nov. 18, we expect to see somewhat softer but decent midweek performance relative to the weekend with business travelers fitting in trips before the Thanksgiving holiday in the U.S. Group demand is also expected to be respectable for this time of year. Weekend performance, however, will be negative as demand normally falls 6 percentage points each day as people prepare for their holiday trip.
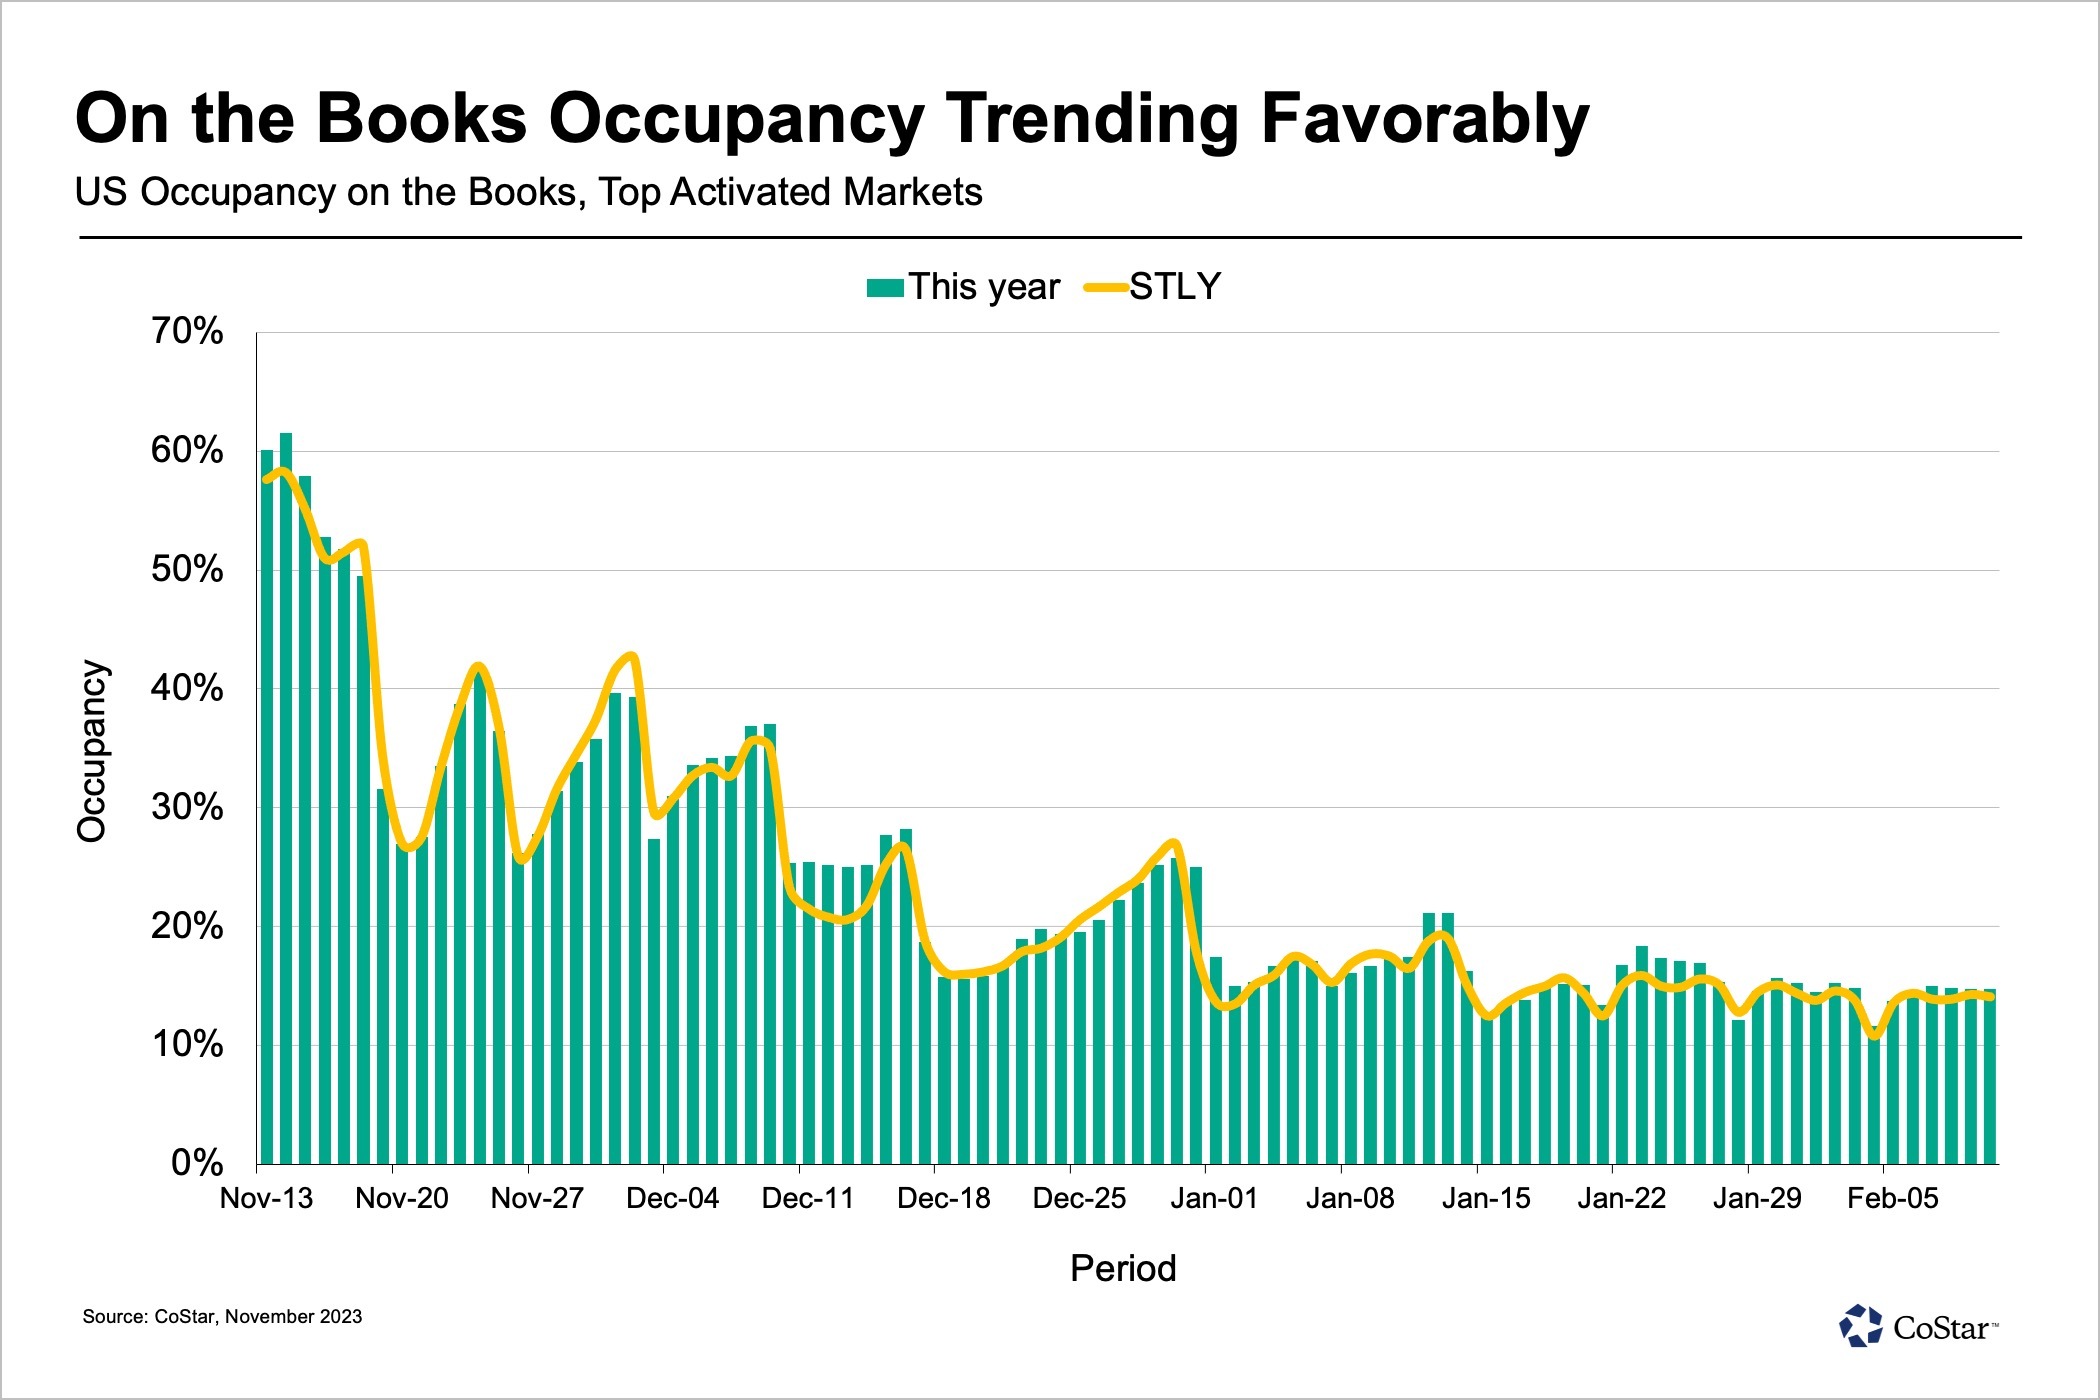
U.S. hotel occupancy will plunge the week ending Nov. 25 due to Thanksgiving. Looking at the past 10 Thanksgivings (excluding 2020 and 2021), demand has fallen week over week by an average of 21%, resulting in a 13-percentage point drop in occupancy. ADR follows, averaging 10% less than the week prior to Thanksgiving. Altogether, RevPAR falls by nearly 30% versus the week before the holiday.
We expect that this Thanksgiving week will follow past results with occupancy near 50%. The 10-year average is 49.6% and has ranged from 45.2% in 2011 to 52% in 2018. In 2019, occupancy was 50.6%. As in past years, ADR will decrease week over week, but it should be up around 2.5% year over year. As a result, weekly RevPAR comparisons will likely remain positive despite the lower demand.
Isaac Collazo is vice president of analytics at STR. Chris Klauda is senior director of market insights at STR. William Anns is a research analyst at STR.
This article represents an interpretation of data collected by CoStar's hospitality analytics firm, STR. Please feel free to contact an editor with any questions or concerns. For more analysis of STR data, visit the data insights blog on STR.com.
