HENDERSONVILLE, Tennessee—As the U.S. hotel industry meanders towards sub-3% revenue-per-available-room growth for 2017, the top-line data suggests that the future will be fine—not great, mind you, but certainly OK. And this interpretation of the data seemed to be mirrored by the mood on the various leader panels at the recent Hunter Hotel Investment Conference.
Nonetheless, digging beyond the record demand and record-high average daily rate, some data points give me pause and make me wonder if the industry is really as healthy as it seems. Below are some numbers and trend lines that are worth keeping an eye on to see if the proposed “soft landing” for the industry will be so soft after all.
- More analysis: “What market RevPAR says about the state of the cycle”
1. Supply increased 2.6% in the top 25 markets in February
The largest lodging markets are still the most attractive to investors and developers; an annualized occupancy of over 73% and an ADR of $151 does that. An active development scene should not come as a surprise, and in the 12 months ending in February, supply growth in the top 25 markets was +2.3%. The February number is even stronger (+2.6%).
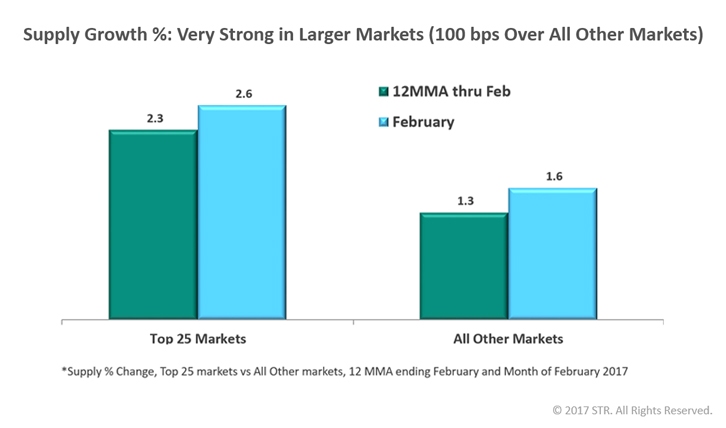
Yes, it is true that demand growth in February was also healthy (+2.2%), but keep in mind that 47% of all rooms under construction are in those large metro areas. So there will be more supply growth. With demand growth already not keeping up with the building boom, the logical consequence is softening in occupancies, and then—maybe—room rates.
So far, annualized ADR growth has been somewhat muted (+2.6%) and only 1.8% for February alone. We will be monitoring how, if and where ADR moves given the new competition in these markets.
2. Transient ADR growth was only 0.7% in February
For some time, we have commented on the fact that group ADR growth has been stronger than transient ADR growth. In the year ending in February 2017, group ADR increased 2.2%, whereas transient ADR increased by only 1.7%. In February alone, growth was much more muted for group (+1.3%) and transient (+0.7%) rooms.
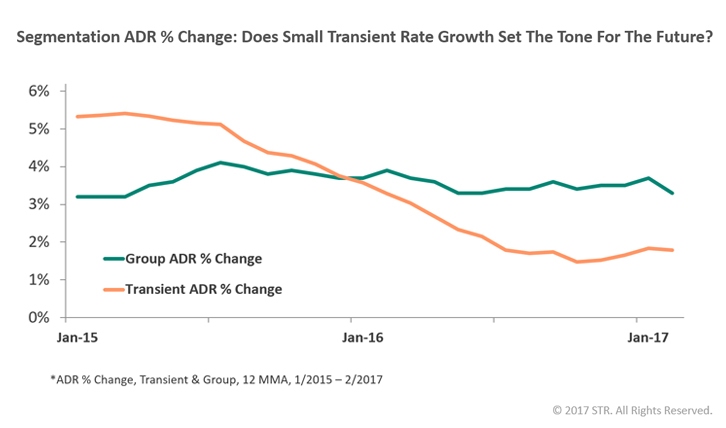
Of course, as we like to say: “One month does not a trend make,” but I am afraid that softening room-rate growth on the transient side could have a signal effect on the group-rate negotiations going on right now for 2018 and beyond.
In other words, if hoteliers do not feel that the current demand and occupancy environment warrants higher transient rates I am afraid that as they sit at the bargaining table for future rates they negotiate from a position of weakness, which could easily translate into smaller group ADR increases in the coming years. And when those rates come to fruition and we report on them, it will of course be much too late to do anything about them.
3. 61% of all upper upscale rooms are being built in only 17 markets
It is no surprise that select-service construction is the name of the game in the U.S. hotel industry. Every developer acting in his or her own enlightened self-interest looks toward the property type with the highest GOP percentage and the highest potential ROI. That means that select-service hotels are in vogue.
It also means that very few hotels with ballroom and meeting space are being built. In February, there were 27,500 upper upscale rooms in construction, but 16,700 of those (61%) are being built in the top 25 markets, actually in only 17 of the top 25 markets.
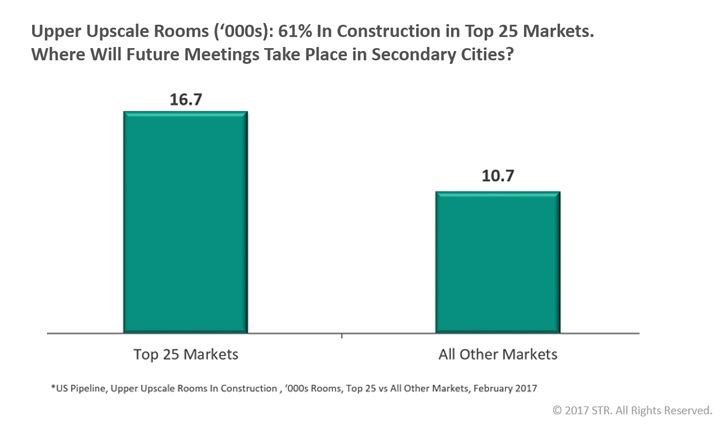
Looking at it differently, in the remaining 139 STR markets we are recording only 10,700 rooms developing in the upper upscale chain scale. I used to quip that “we are not building ballrooms anymore,” and indeed developers vote with their wallet and against larger meeting hotels. This is all well and good—until it is not. (STR is the parent company of Hotel News Now.)
The economy will continue to grow and meetings demand will continue. But where will groups meet? In the secondary and tertiary cities, space availability could be an issue sooner rather than later.
4. More submarkets are reporting negative RevPAR
Even though from a 30,000-foot perspective total U.S. data still seems fine, the underlying submarket data already shows signs of weakening.
STR breaks up the U.S. into 639* submarkets. One way to understand how the industry is performing is to look at the underlying submarket data and simply look at the markets that grew RevPAR. The more markets grow RevPAR the better it is for the U.S. as a whole.

In 2014, at the height of the second rebound in demand after 2009, the number of markets that showed positive RevPAR growth was 97%, so only 3% of the submarkets reported declines. Fast forward to 2016 and more than one in five submarkets reported RevPAR declines.
Through February 2017, more than one in three markets reported falling RevPAR numbers. The trend is clear, and it will be very interesting to observe the amount of submarkets that struggle keeping occupancy and RevPAR positive as the year progresses.
5. The ‘USA’ brand matters to tourists
Our friends from Tourism Economics published a chart that got renewed attention when I presented it lately. They overlaid data from Pew Research Center about favorability ratings by country with arrival data from those countries. We can use this to compare global perception of the U.S. to the country’s change in number of arrivals over time. The data is from the early 2000s while George W. Bush was in office.
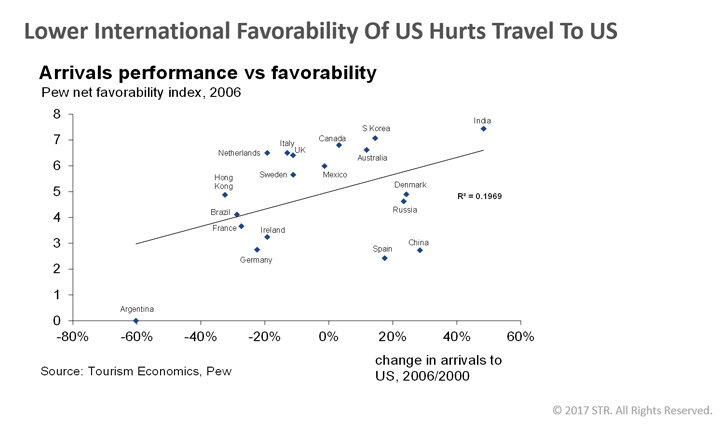
Granted, an R-squared of 0.2 does not point at a very strong relationship, but there seems to be a connection nonetheless. Intuitively, it seems to make sense that when travelers have choices to spend their hard-earned currency they would choose a country that seems welcoming to international visitors.
The rhetoric from the current administration around safety and security, including a ban on travelers from some foreign countries, potentially could have an impact on travel numbers into the country. The strong U.S. dollar certainly does not help, but I am afraid that the brand that the U.S. projects could be tarnished and that global travelers might choose to spend their vacations elsewhere and put off business trips. It has happened before.
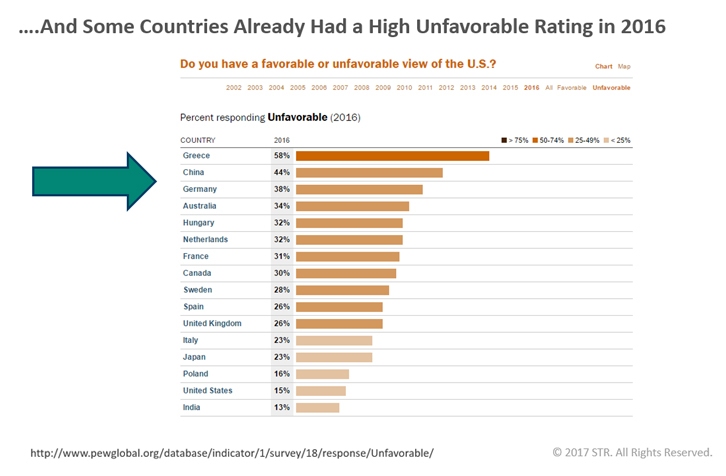
The latest Pew data shows that two major feeder countries, China and Germany, already had fairly sizeable unfavorable ratings in 2016. It will be important to monitor if those countries are voting with their wallets once again in 2017 and beyond.
This article represents an interpretation of data collected by STR, parent company of HNN. Please feel free to comment or contact an editor with any questions or concerns.
*Correction: A previous version of this story misrepresented the number of U.S. submarkets by which STR breaks down data.