Small to midsized hotels, with fewer than 300 rooms, and hotels in the economy segment continue to lead the U.S. hotel industry recovery, with demand over the past six weeks reaching 90% or more of 2019 levels.
Average occupancy at small to midsized hotels was 60% in the week of April 24, while demand for large hotels, with more than 300 rooms, was less than half of what it was in 2019.
Demand at economy hotels was 99% of the level achieved during the same week in 2019, while upper-upscale hotel demand was just 44% of 2019 levels.

Overall, more than half of U.S. hotels (52%) had occupancy above 60% for the week of April 24 — unchanged from the previous week.
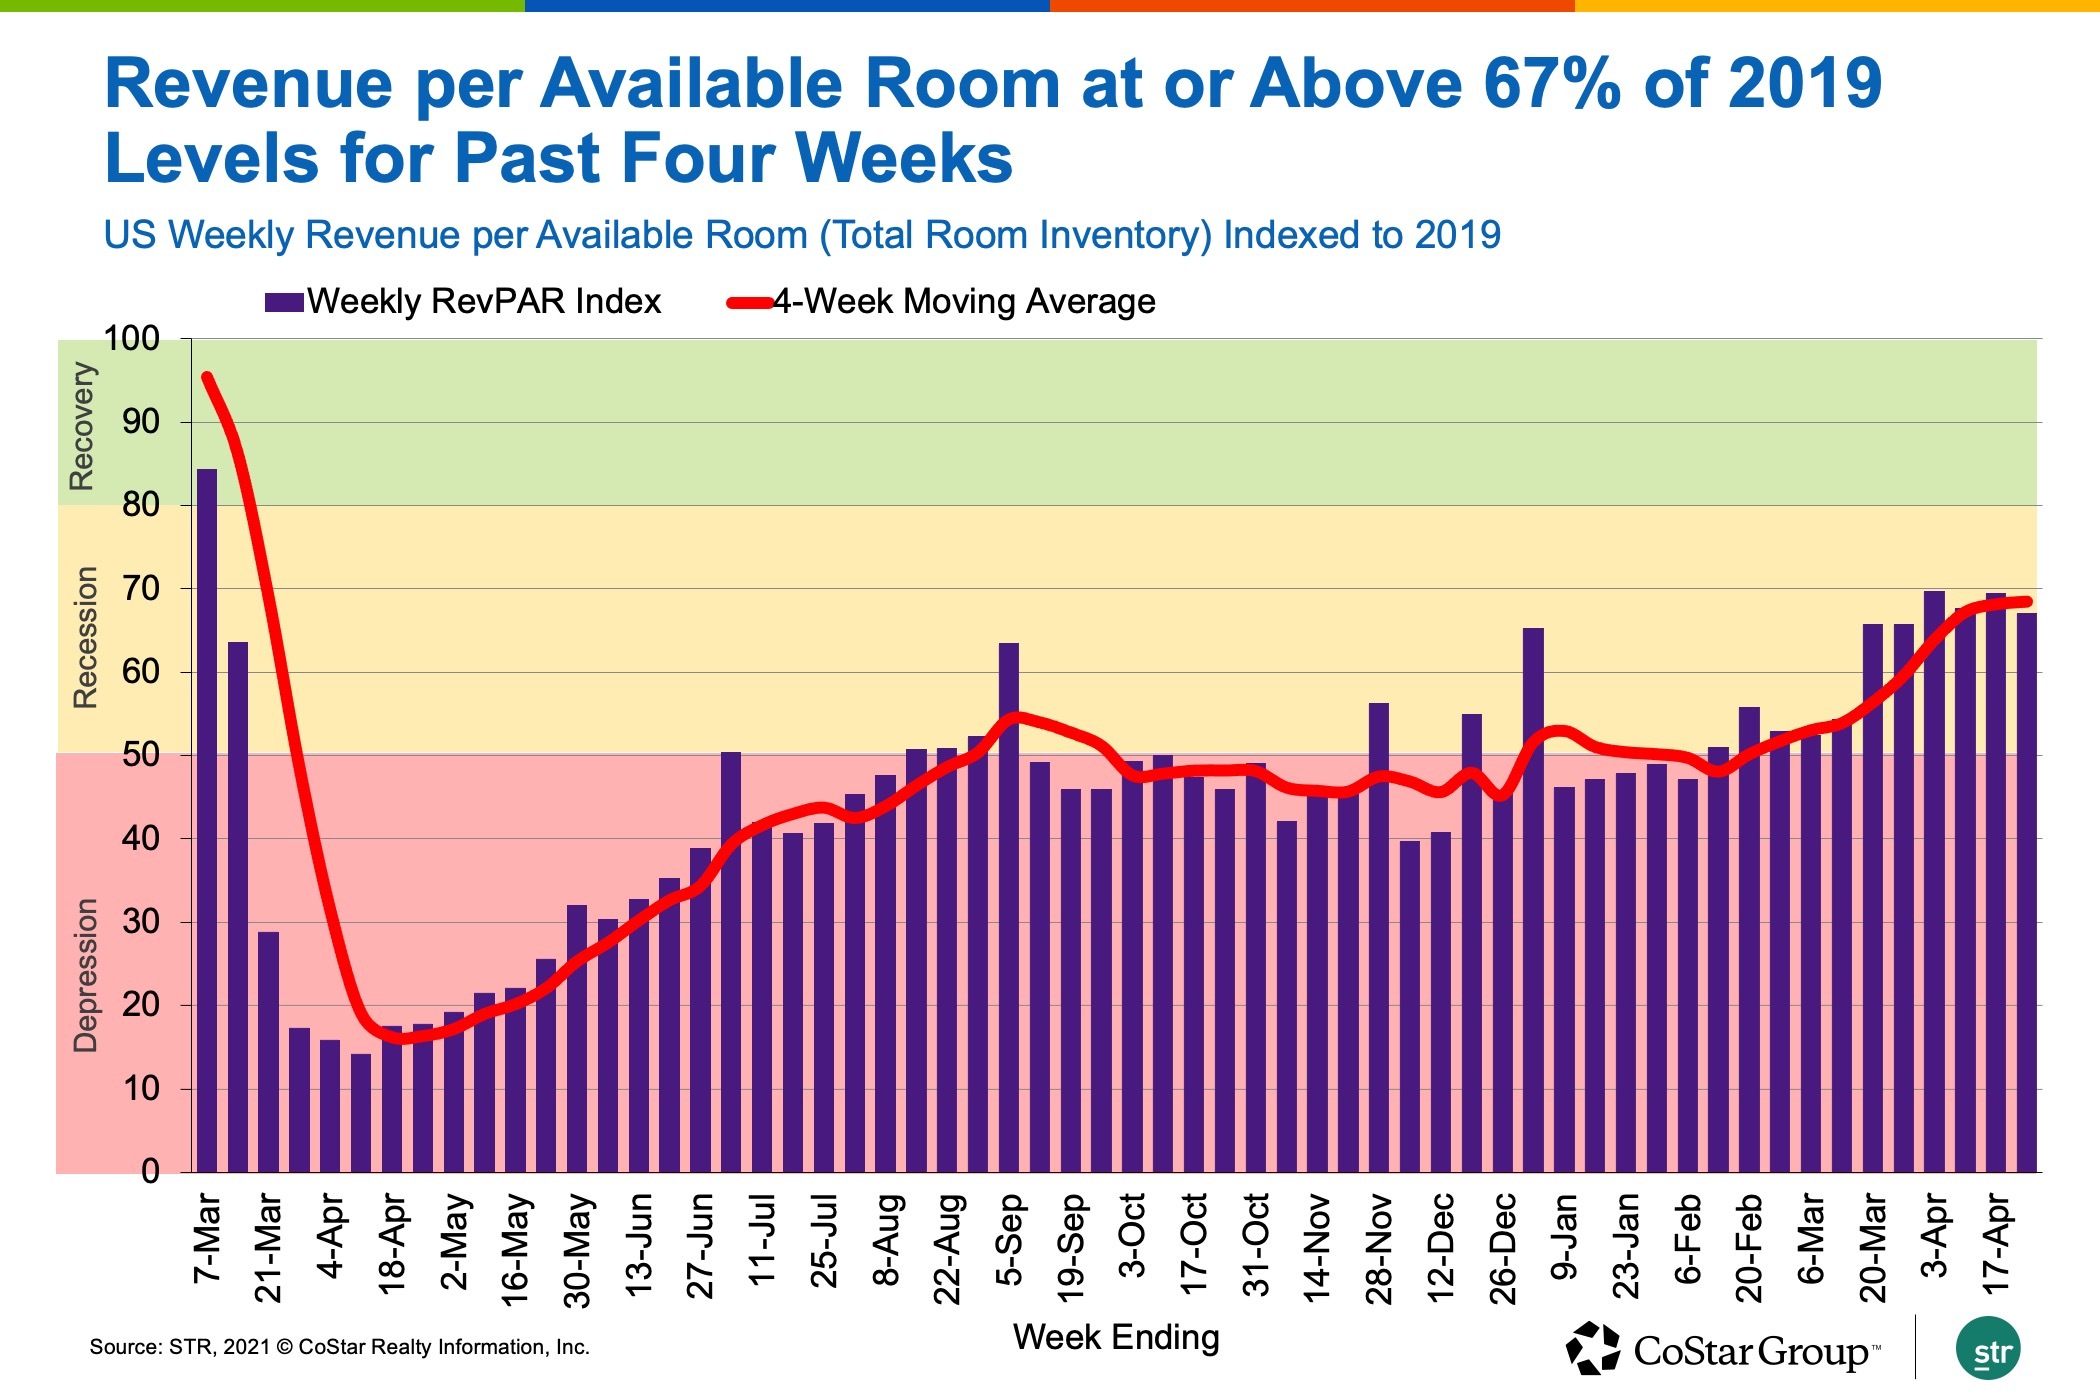
STR’s Market Recovery Monitor, which indexes the most recent weekly hotel performance against pre-pandemic 2019 performance, shows that U.S. hotel revenue per available room for the week was 70% of what it was during the same week in 2019. RevPAR has been at or above 67% of 2019 levels for the past four weeks.

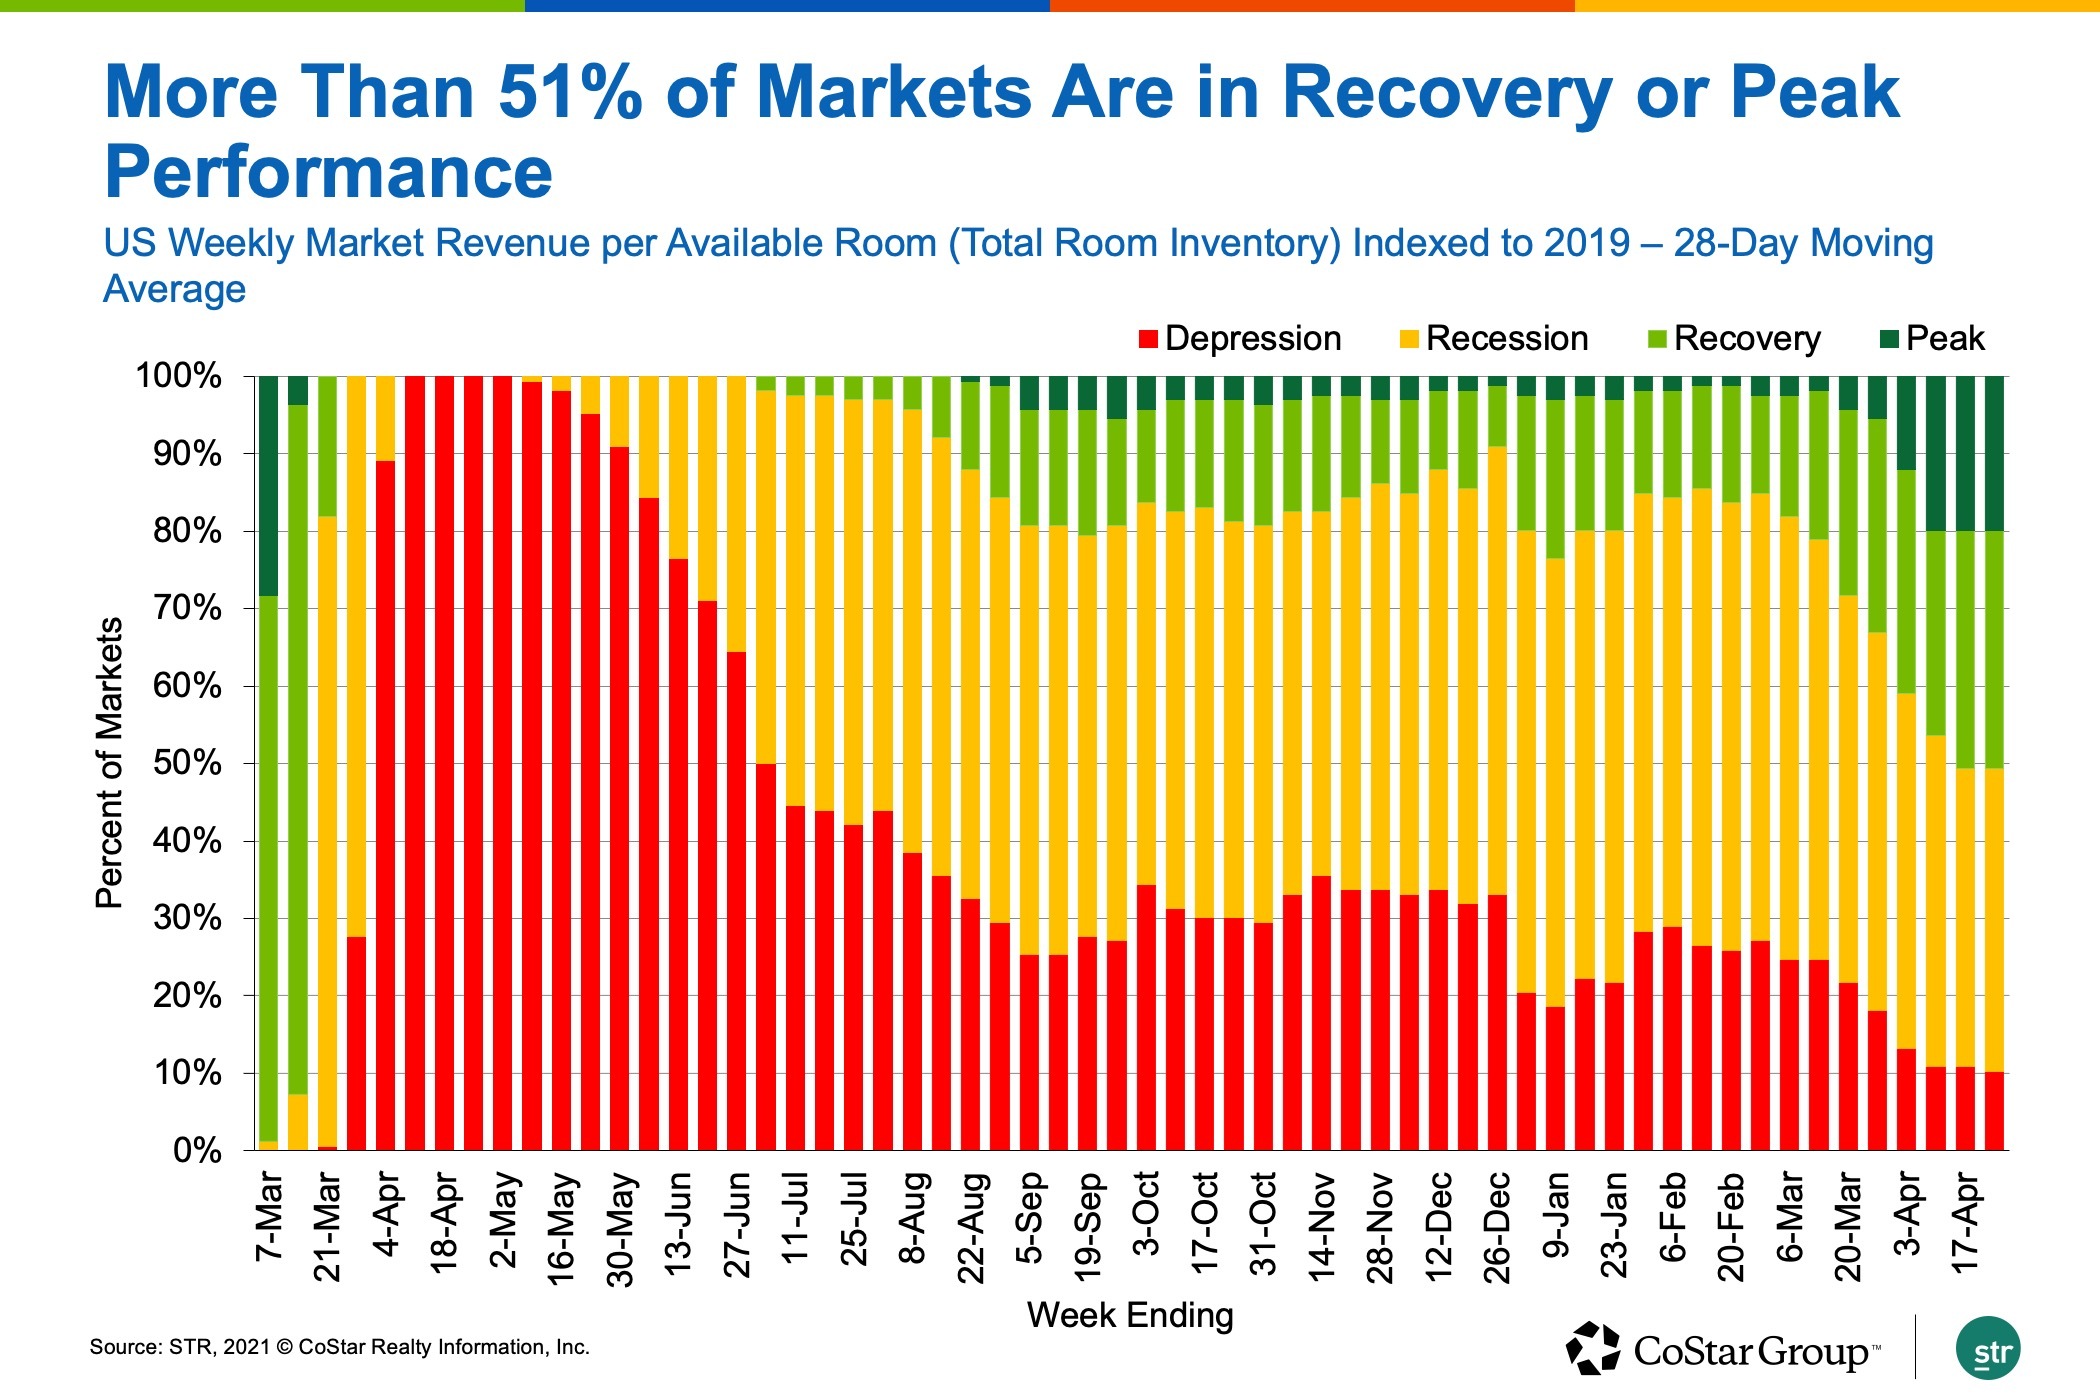
More U.S. hotel markets performed at “recovery” or “peak” levels in the week of April 24, with 51% of the 166 markets posting RevPAR at 80% or more of 2019 levels.
More than half (54%) of economy hotels achieved RevPAR for the week that was higher than 2019 levels, compared to only 8% of upper-upscale hotels that beat 2019 RevPAR and 53% with RevPAR that was less than half of what it was for the same week in 2019. In upper-midscale, the largest branded U.S. hotel chain scale, 28% of hotels posted RevPAR performance above 2019 levels — up from 19% at the beginning of the year.

Seventeen markets remained in the “depression” category — down from 18 in the past two weeks — with RevPAR at 50% or less of 2019 levels. At the bottom of the index are San Francisco and New York, where hotels posted RevPAR for the week that was less than 22% of 2019 levels.
Average daily rate across the U.S. hotel industry for the week of April 24 was 84% of the level achieved during the same week in 2019, growing week-over-week by slightly less than 1%.
Weekly Performance
Week-over-week performance growth has stalled, with U.S. hotel occupancy for the week of April 24 flat with the previous week at 57%. Factoring in temporarily closed hotels, occupancy for the week was 54%. Weekly room demand increased slightly, at more than 21 million rooms sold for the sixth consecutive week.
Weekday U.S. hotel occupancy is showing signs of catching up with weekend demand, growing by an average of 16% over the past four weeks, compared to 10% occupancy growth on weekends. Weekend occupancy was 70%, or 67% including temporarily closed hotels. This trend in weekday occupancy could be a signal of returning business demand.

Room demand fell in Texas, Florida and California — markets that each sold more than 2 million rooms over the past six weeks.
Florida had the largest room demand decrease, but weekly occupancy remained solid at 65% and among the highest in the country.
Demand in both Texas and Florida was very close to the level posted in the same week of 2019.
There were 22 states that captured more than 90% of their 2019 room demand in the week of April 24, with several surpassing 2019 levels.
Going forward, until an expected summer demand surge, U.S. hotel performance growth is expected to slight.
Isaac Collazo is VP Analytics at STR.
This article represents an interpretation of data collected by CoStar's hospitality analytics firm, STR. Please feel free to contact an editor with any questions or concerns. For more analysis of STR data, visit the data insights blog on STR.com.
