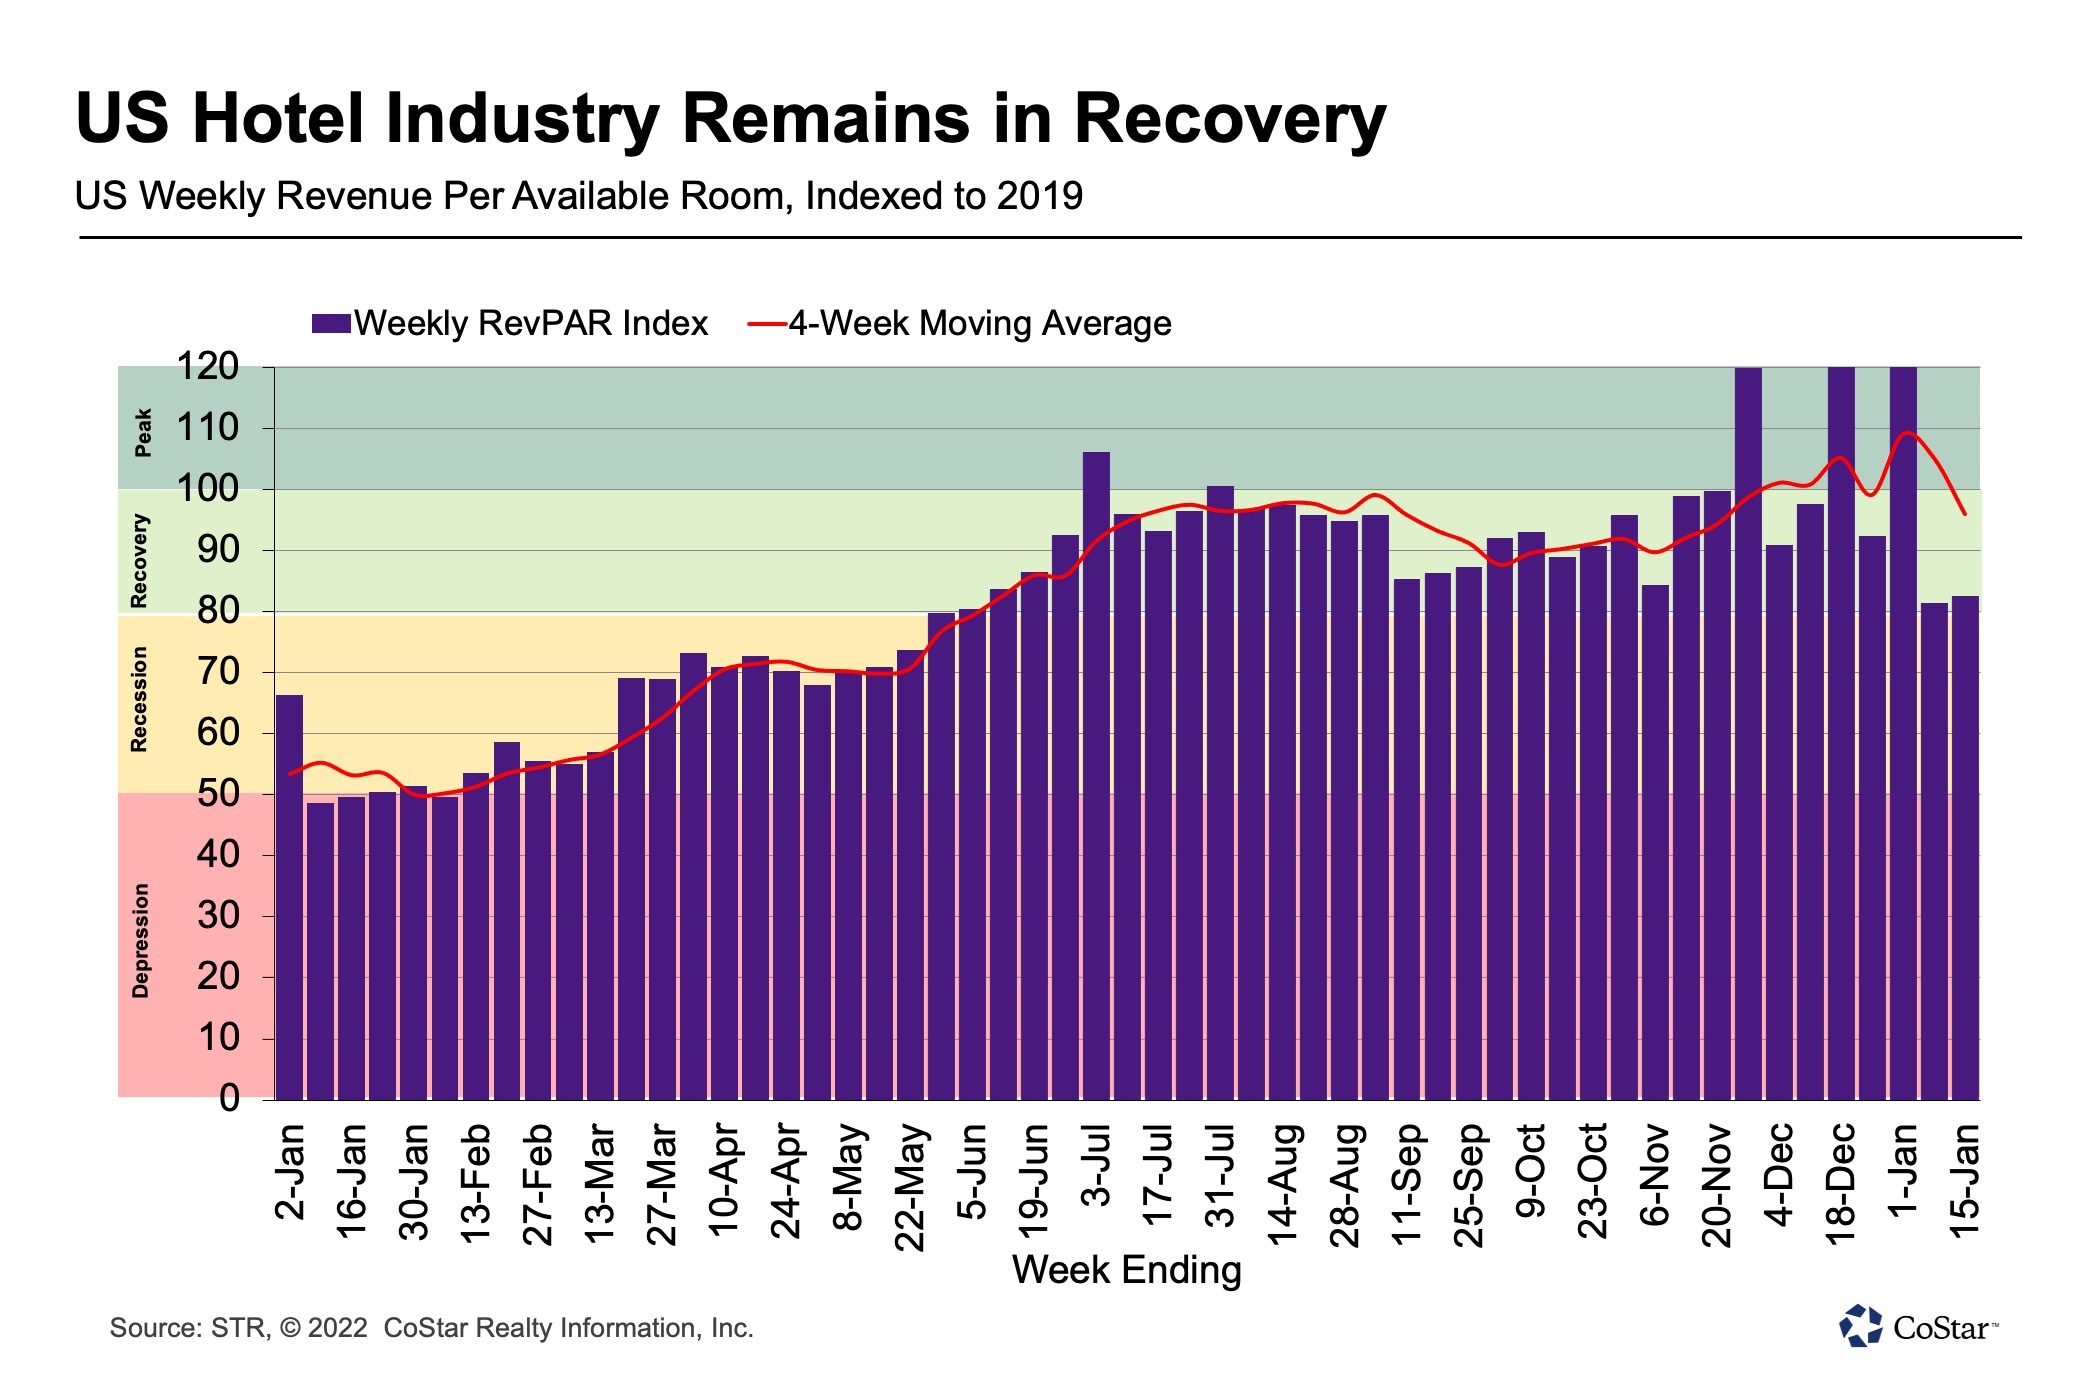
Pricing power in leisure travel destinations and airport markets continue to keep the U.S. hotel industry recovery on track despite hotels being less than half occupied on average.
In the latest data from CoStar hospitality analytics firm STR, U.S. hotel occupancy was below 50% for a second straight week, but higher rates pushed hotel revenue per available room up 9% from the previous week.
At 48.8%, occupancy for the week ending Jan. 15 was 10 percentage points lower than it was in the comparable week of 2019. Against comparable weeks going back to 2000, it ranked in the bottom third of results.
The latest weekly data shows the occupancy gap to 2019 expanding. However, U.S. hotel average daily rate was just below 2019 levels for the week. As a result of both week-over-week occupancy and ADR growth, RevPAR advanced 9% to $122, which was 82% of what it was for the same week of 2019 — a 1% weekly improvement in the index to 2019.
The continued heavy lifting of leisure travel demand is evidenced by the better performance of hotels on weekends, as well as the lower performance of hotels in large, urban markets.
Weekday occupancy continued to be a drag on performance even though it was up two percentage points from the previous week to 45.3%, which was among lowest weekday occupancy since early 2021. Sunday occupancy was particularly low at 39.2% before Monday through Wednesday occupancy hit 46.5%, but those three days were more than 14 percentage points lower than the same days of 2019.
Weekend occupancy was better at 57.5%, but also was on the lower range of performance compared with the previous 52 weeks.
More than half of all U.S. hotels reported occupancy below 50% during the week, but a week ago, nearly 60% of hotels were in that range.

Weekly occupancy ranged from 34% in large, urban hotels within the top 25 markets to 56% in airport hotels regardless of market.
Weekday — Monday to Wednesday — and shoulder — Sunday and Thursday — occupancy was weak at about 34% at large hotels in and outside of the top 25 Markets, highlighting the dearth of business and conference travel. However, weekend occupancy for large hotels was better at 55% and closer to the level achieved by all other hotels (59%). The highest occupancy was recorded in small- to medium-sized resort hotels, where weekend occupancy reached 70%.

Even though U.S. hotel ADR averaged lower than 2019 levels, two-thirds of all markets and a similar percentage of hotels reported ADR premiums over 2019.
Nearly 40% of hotels reported weekly ADR that was 10% or more of their 2019 value. Among those hotels, 62% are in suburban or small metro/town locations within the top 75 U.S. markets based on supply.
The weekly ADR increase was also driven by weekends.
Weekday ADR fell by 2% from the previous week, whereas weekend ADR was up 8% week-over-week and up 10% compared to the same weekend in 2019. More than 75% of hotels reported an ADR premium to 2019 over the weekend with 51% achieving more than a 10% premium. Additionally, of hotels opened in 2019 and 2022, 65 posted ADR above $1,000 versus 21 in the same week of 2019.
According to STR’s “Market Recovery Monitor,” U.S. hotel industry RevPAR remained in the recovery category — between 80% and 100% of 2019 levels. But adjusted for inflation, weekly RevPAR was only 74% of what it was in the comparable week of 2019.

At the market and property level, 46% of markets and 37% of all hotels posted RevPAR for the week that was higher than 2019 levels, on an inflation-adjusted basis.

Market Highlights
On a market level, the Florida Keys led the nation with 79% occupancy for the week, which was higher than the comparable week of 2019 and 21 percentage points higher than 2021.
Of the top-10 highest occupancy markets, seven were in Florida with all reporting double-digit year-over-year gains.
Two Hawaiian markets — Hawaii/Kauai and Oahu — were also in the top 10 for occupancy, another indication that leisure travel remains strong despite being in a bit of a lull post-holidays.
While weekly occupancy was weaker than what it was for most of last year, it’s worth noting that nearly every market (96%) posted year-over-year occupancy gains. Additionally, hotels in 39 markets — mostly rural areas — posted occupancy exceeding 2019 levels.
Occupancy in key top 25 markets was soft as New York City, Washington, D.C., San Francisco and Chicago all reported occupancy of 40% or less. Weekday occupancy for those four markets was even weaker at 36% or less.
Hotels in central business districts of the top 25 averaged 34% weekday occupancy; Chicago had the lowest at 18%.
Isaac Collazo is VP Analytics at STR.
This article represents an interpretation of data collected by CoStar's hospitality analytics firm, STR. Please feel free to contact an editor with any questions or concerns. For more analysis of STR data, visit the data insights blog on STR.com.
