The U.S. hotel industry finished the month of September strong, with preliminary results indicating room demand was the second-highest ever for the month.
September room demand has been helped by the accelerated recovery of business and group travel, which is evident in weekday occupancy gains, particularly in the top 25 largest U.S. hotel markets.

San Francisco, the slowest of the top 25 markets to recover from the pandemic, posted the highest weekday (Monday-Wednesday) occupancy in the last week of September at nearly 90%. For the full week, San Francisco occupancy was 83.2%. So far in 2023, the market has had two weeks of 80%-plus occupancy; in 2022, it had three weeks above that mark.
CoStar and its hospitality analytics division STR will monitor the market in the coming weeks to assess if there could be a shift in business and group travel sentiment.
The best September hotel room demand on record was last year’s, when occupancy was also 0.3 percentage points higher than this year. Preliminary data from CoStar shows September 2023 occupancy reached 66.3%.
Room demand is calculated as the number of room nights sold, while occupancy is a percentage of rooms available that are sold. It’s possible for room demand to be higher while occupancy is lower year over year because of supply growth — more rooms sold, but a smaller percentage of the whole.

One factor in the year-over-year comparison is that both the Rosh Hashanah and Yom Kippur Jewish observances occurred in September this year, while the two were split between September and October last year.
In the last week of the month, group demand actually was down 9.2% compared to the previous week, but it was 8.9% higher than a year ago and the absolute number of rooms booked to groups was among the highest of the past 14 weeks.
For the entire month of September, average daily rate increased 3.5%, while revenue per available room increased 3%. These are the highest gains since May.
US Performance Highlights
Five markets reported occupancy above 80%, led by Portland, Maine; Boston; New York City; San Francisco; and Denver. Since March 2020, San Francisco's occupancy has only been above 80% three times, compared to 38 times for all of 2019.

San Francisco led the nation with the highest weekday (Monday-Wednesday) occupancy at 88.8%, followed by Louisville at 88.7%.
New Orleans hosted Beyonce’s Renaissance tour Wednesday night, boosting occupancy to 74.7%, but the market still posted the lowest weekday occupancy of any of the top 25 markets at 58.8%.
Global Performance
Global occupancy, excluding the U.S., was 69%, down 3.1 percentage points compared to the previous week. This is similar to the decrease in the same two-week period of 2019, when occupancy declined 2.6 percentage points. Compared to last year, occupancy was up 4.6 percentage points, which was the same as a week prior. ADR climbed to $159, up 18.5% year over year. RevPAR grew 26.9% to $109, up 26.9%.

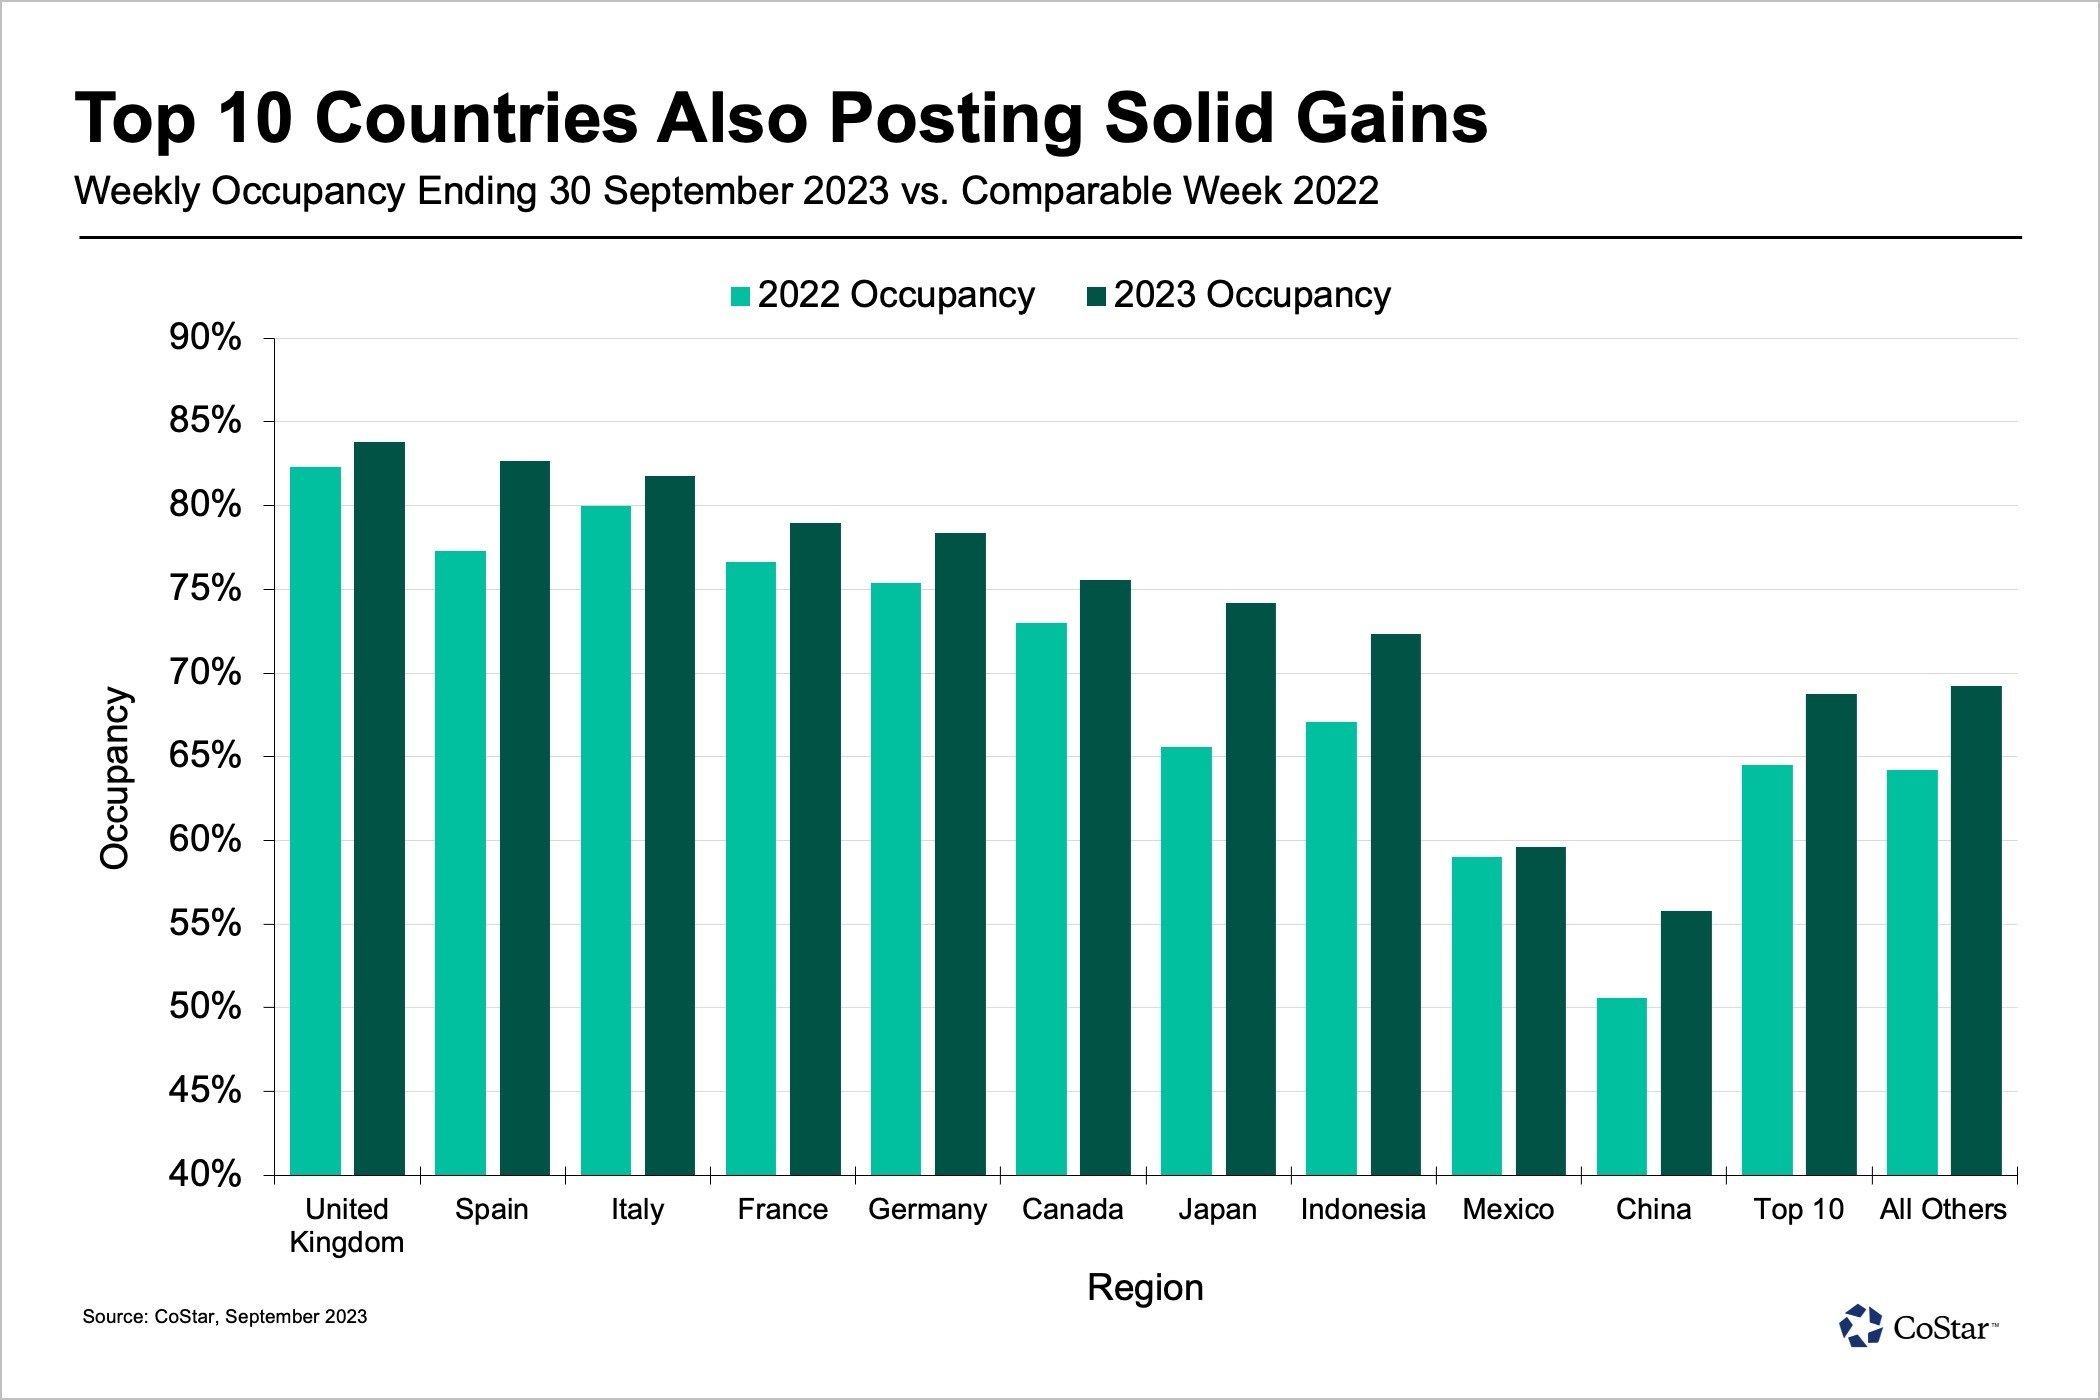
Occupancy for the top 10 countries based on supply also fell week over week, down 5.6 percentage points to 68.7%. ADR for the same countries increased $12 to $155, which was the highest result since the last week of June this year. Year over year, occupancy was up 4.3 percentage points, ADR 18.6% and RevPAR 26.5%.
All countries within the top 10 posted year-over-year occupancy gains. The largest growth was in Japan, up 8.6 percentage points to 74.2%. Japan also continued to report the highest RevPAR growth, up 82.7% to $119. Part of this boost is likely due to the timing of its mid-autumn festival, which extended into the weekend. Both China and Indonesia also posted strong RevPAR growth, up 54.4% and 38.9% respectively. Conversely, the United Kingdom, which had the highest occupancy of the top 10 countries at 83.8% was up just 6.6% compared to the same week in 2022.

Isaac Collazo is vice president of analytics at STR. Chris Klauda is senior director of market insights at STR. William Anns is a research analyst at STR.
This article represents an interpretation of data collected by CoStar's hospitality analytics firm, STR. Please feel free to contact an editor with any questions or concerns. For more analysis of STR data, visit the data insights blog on STR.com.


