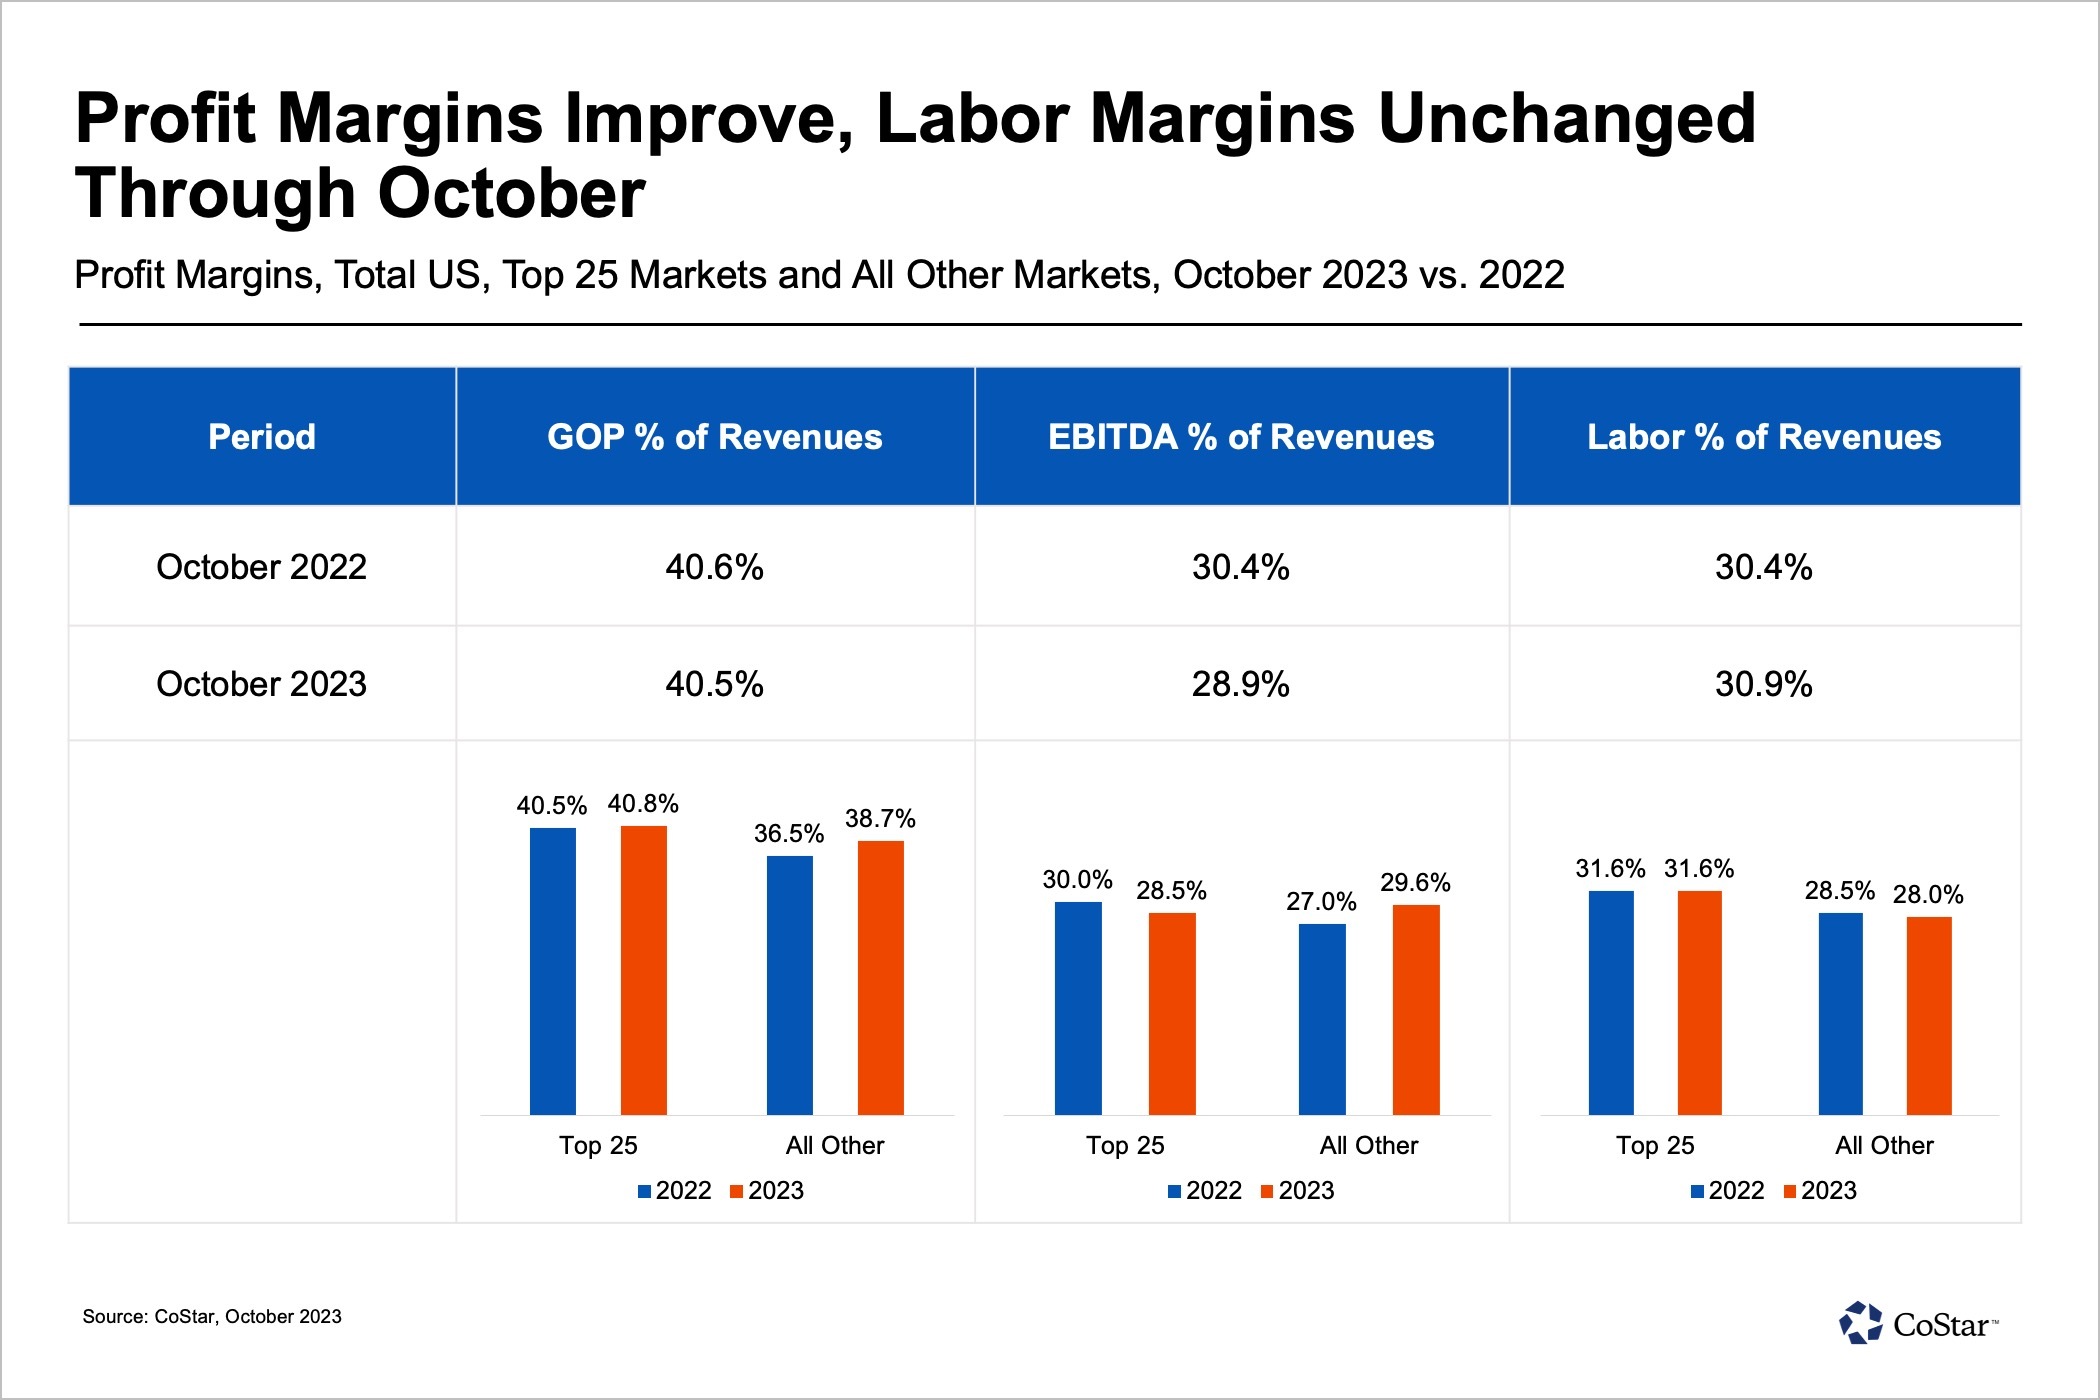
Fewer room nights were booked at U.S. hotels in October than in September, but total hotel revenues and profits increased month to month and year over year.
One explanation for that is that the demand for hotel rooms in October was predominantly driven by groups and events, and those guests tend to spend more on hotel food and beverage.
Here are five things to know about U.S. hotel profitability, from CoStar's latest profit-and-loss data.

1. Revenues Up Despite Demand Dip
October was another month of weak demand for hotels in the U.S. Room nights sold dropped 1.2% year-over-year, making October’s performance the weakest since April. This demand was associated with events, boosting revenues in other departments, including food and beverage. As a result, total revenues increased 4% year over year, the strongest improvement since March.
2. Events, Group Business Making a Comeback
Food-and-beverage revenues per occupied room reached a new record at $82.99 in October 2023 an increase of 9.2% year over year. This has been the highest level of revenue per occupied room since October 2018, when it peaked at $81.95.
Most of this revenue comes from food sales from the banquet and catering area, accounting for $24.28 per occupied room, which grew 18.6% year over year. Other significant contributors include food from venues — $12.53 per occupied room, up 6.8% year over year — and food-and-beverage service charges — $8.57 per occupied room, which rose 17.7% year over year. These are all strong indicators that group business and events are rebounding.
3. Growth Led By Top 25 Markets
The U.S. top 25 markets reported 4% growth in gross operating profits per available room (GOPPAR) in October, the strongest since March 2023. Both total revenue per available room (TRevPAR) and labor costs per available room (LPAR) increased 3.7% year over year, making this the third consecutive month of softening LPAR growth.
Markets outside the top 25 posted weaker performance as GOPPAR growth was nearly stagnant at 0.9%. The LPAR growth of 8.6% year over year, which accounts for 31% of revenues, outpaced the 3% growth in TRevPAR.
4. Luxury, Upper-Upscale Group Demand
Luxury and upper-upscale hotels in the U.S. reported the highest group demand since October 2018. Upper-upscale chains continue to lead the growth in revenues and profits, with more than 16% GOPPAR growth through October year to date. Higher demand increases the need for higher staffing levels. As such, labor costs per available room for luxury chains has increased 12% for the same period. On the flip side, TRevPAR for luxury hotels has increased 5%, making it the only scale to show GOPPAR declines (-2.5%) so far this year.
5. Ups and Downs for Global Profitability
Asian countries were the last to lift COVID-19-related restrictions, and hotels in the area are still catching up to pre-pandemic performance levels. Consequently, hotels in Asia-Pacific markets posted some of October's strongest performance, with GOPPAR increasing $35 from October 2019 to 2023. Gross-operating-profit margin increased 2 percentage points in this time frame.
Changes in profitability levels for Europe are more subdued. European hotels reported a 10% increase in LPAR in October, which paired with weaker TRevPAR growth at 4%, leads to flat GOPPAR, which increased 0.6%.
Hotels in the Americas showcased strong cost control approaches in October, as GOP margin dropped only 1 percentage point despite a $25 decrease in GOPPAR.
In the Middle East, decreases were seen across the board. TRevPAR decreased 3.5%, but labor costs per available room decreased a nearly equivalent level, and therefore GOPPAR sustained a loss of less than 1%.
Claudia Alvarado is a senior analytics manager at STR, CoStar's hospitality analytics division.
