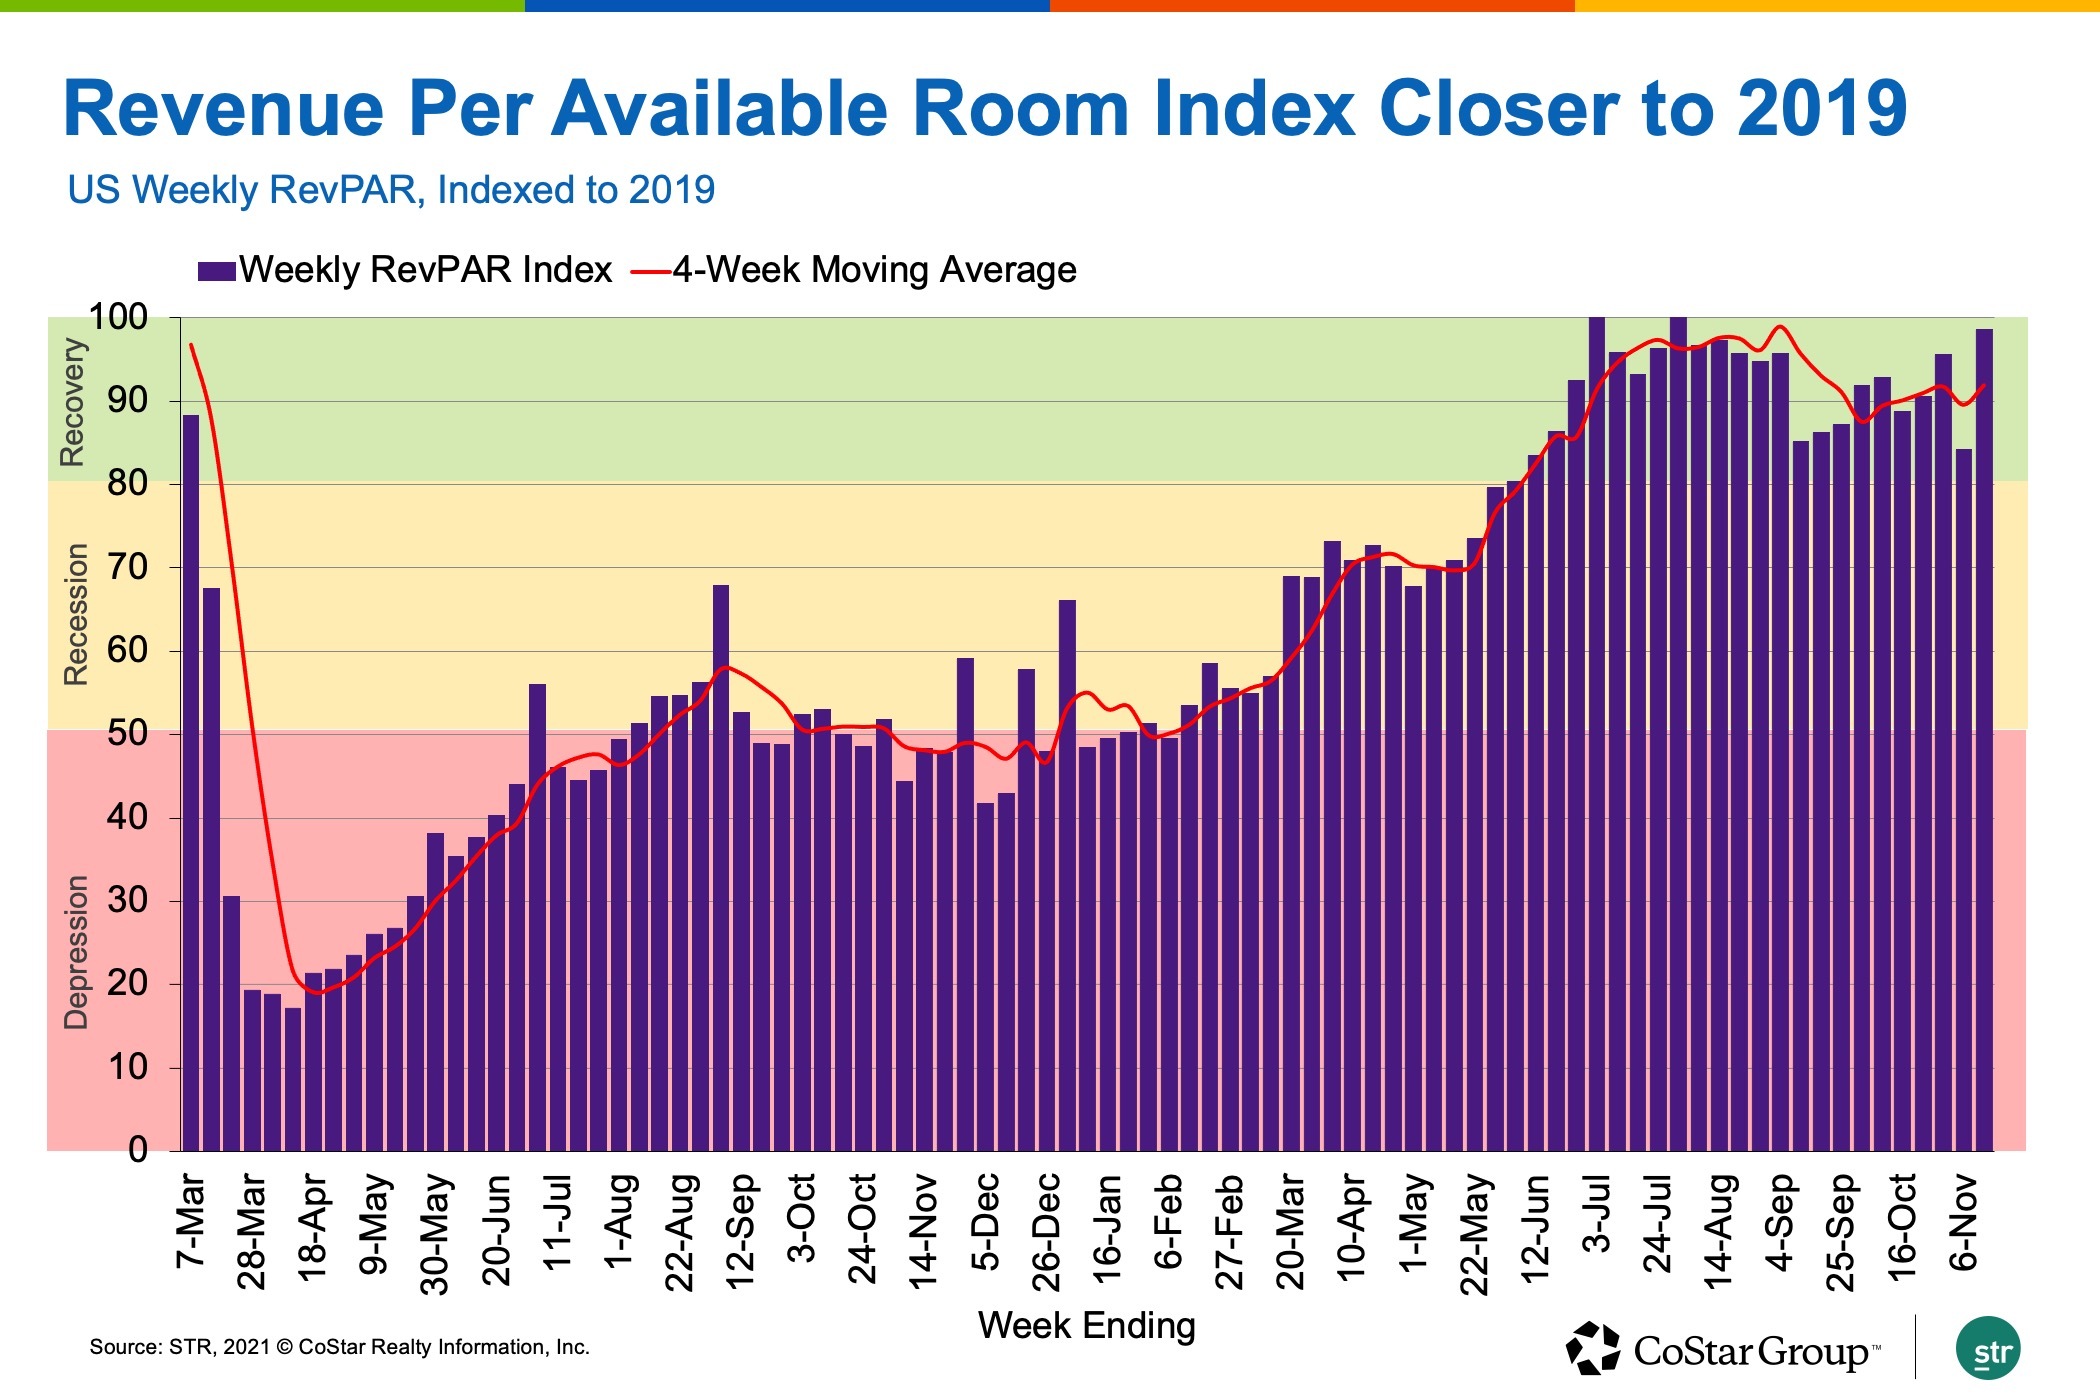
The strength of weekday bookings, which typically indicate business travel, propelled U.S. hotel demand to its largest weekly gain since early October, as revenue per available room industrywide was the closest it has been to 2019 levels since August.
The latest weekly U.S. hotel performance reinforces STR’s updated forecast, which predicts the industry will return to 2019 demand and average daily rate levels by late 2022. The improvement comes a week after the U.S. border opened to international travelers.
For the week ending Nov. 13, the U.S. hotel industry sold 704,000 more room nights than it did the previous week, according to the latest “Market Recovery Monitor” report by STR, CoStar’s hospitality analytics firm.
Weekly demand has increased in 21 of the past 33 weeks and the most recent week’s gain was the 10th largest in that span. With the increase, occupancy advanced to 61.6%, up 1.9 percentage points from the previous week.
U.S. hotel occupancy was 96% of what it was over the same week in 2019 — the highest it has indexed since early July.

Average daily rate also improved, up 1.3% week over week, to a level that was 3% higher than what it was in 2019. As a result, revenue per available room strengthened by 4.5% in the week and reached its best 2019 comparison since August.
Weekdays accounted for most of the increase in hotel demand. The week-over-week gain in weekday demand was the largest recorded since the week after Labor Day.
Demand increased the most on Sunday and Monday, with strong improvements also on Tuesday and Thursday. While those days led the week’s performance, weekday occupancy remained lower than weekends — 57% versus 73%.
Weekday occupancy was 90% of what it was in the same week in 2019, while occupancy over the weekend was 11% higher than it was in 2019.
In the top 25 markets, hotel bookings Monday through Wednesday accounted for nearly half of the weekly demand gain. This indicates that business travel continues to strengthen even as the year draws to a close. Occupancy in the top 25 markets on those three days reached 59%, the highest since late summer, and was led by Phoenix at 73% occupancy.
New York City followed Phoenix with a three-day weekday occupancy of 68%, which is the highest in the market since the week before the first lockdown. New York City’s complete weekday occupancy between Sunday and Thursday hit 69%, and its weekend level topped 87%, which were both pandemic-era highs that contributed to a full-week average of 74%.
More than half of hotels reported occupancy above 60%. In the top 25 markets, nearly two-thirds of hotels were at or above that level. In New York City, more than three-quarters of hotels reported occupancy above 70%, with 22% of hotels reporting occupancy at 90% or greater, the most of the past 20 weeks.

ADR advanced week over week in 54% of all markets with the largest gains observed in destination locations, including Daytona Beach, the Florida Keys and New Orleans. Weekly ADR in 80% of all markets was higher than it was in the comparable week of 2019. Adjusted for inflation, 57% of all markets reported higher ADR than in the same week of 2019. Overall, weekly ADR on an inflation-adjusted basis was 96% of the 2019 level, similar to what it was over the summer.
Weekly RevPAR was 99% of 2019 levels, which was among the highest values of the year. Adjusted for inflation, RevPAR was 93% of what it was in 2019. The industry remains in the “recovery” category according to STR’s “Market Recovery Monitor.”

On a 28-day moving total basis, RevPAR was 92% of what it was in 2019, with 62% of markets at “peak,” with RevPAR exceeding 2019 levels. Adjusted for inflation, 49% of markets were at “peak” RevPAR, and another 34% were in “recovery,” with RevPAR between 80% and 100% of 2019 levels.

San Francisco and San Jose remain the only two markets in the “depression” category, with RevPAR below 50% of 2019 levels. Both markets, however, are improving.
Isaac Collazo is VP Analytics at STR.
This article represents an interpretation of data collected by CoStar's hospitality analytics firm, STR. Please feel free to contact an editor with any questions or concerns. For more analysis of STR data, visit the data insights blog on STR.com.
