Key metrics for U.S. hotel performance were down slightly in the latest weekly data from STR, and history suggests that the peak of the fall travel season has come and gone.
For the week ending Oct. 22, U.S. hotel occupancy was down 0.4 percentage points from the previous week to 69.9%. Occupancy for the past two weeks, however, has averaged 70.1%, surpassing 70% for only the seventh time in the past 23 years over this two-week period.
Average daily rate was also down 0.1% week over week to $157 but was 17% higher than the same week of 2019. When adjusted for inflation, ADR still surpassed 2019 by 1.1%. Revenue per available room decreased 0.7% week over week to $110 and was just slightly better than in 2019 when adjusted for inflation.
Room demand — the number of hotel room nights sold — in the current week and next is expected to fall more significantly as families stay home for Halloween, which is on a Monday this year. In past years with the same day-of-week composition, room demand fell by about 5% in the week of Halloween.
The slowdown in hotel performance is normal for this time of year. For the week ending Oct. 22, demand was down 142,000 room nights from the previous week. Over the same period of 2019, demand was down 755,000 room nights. Available rooms are up 887,000 from 2019, and the U.S. hotel industry sold 370,000 more rooms over this two-week period than it did in 2019, when occupancy was 1.1 percentage points higher.

Weekend occupancy slid for a second week, down 1.2 percentage points week over week to 77.8%. Compared to 2019, occupancy over the weekend was nearly three percentage points higher.
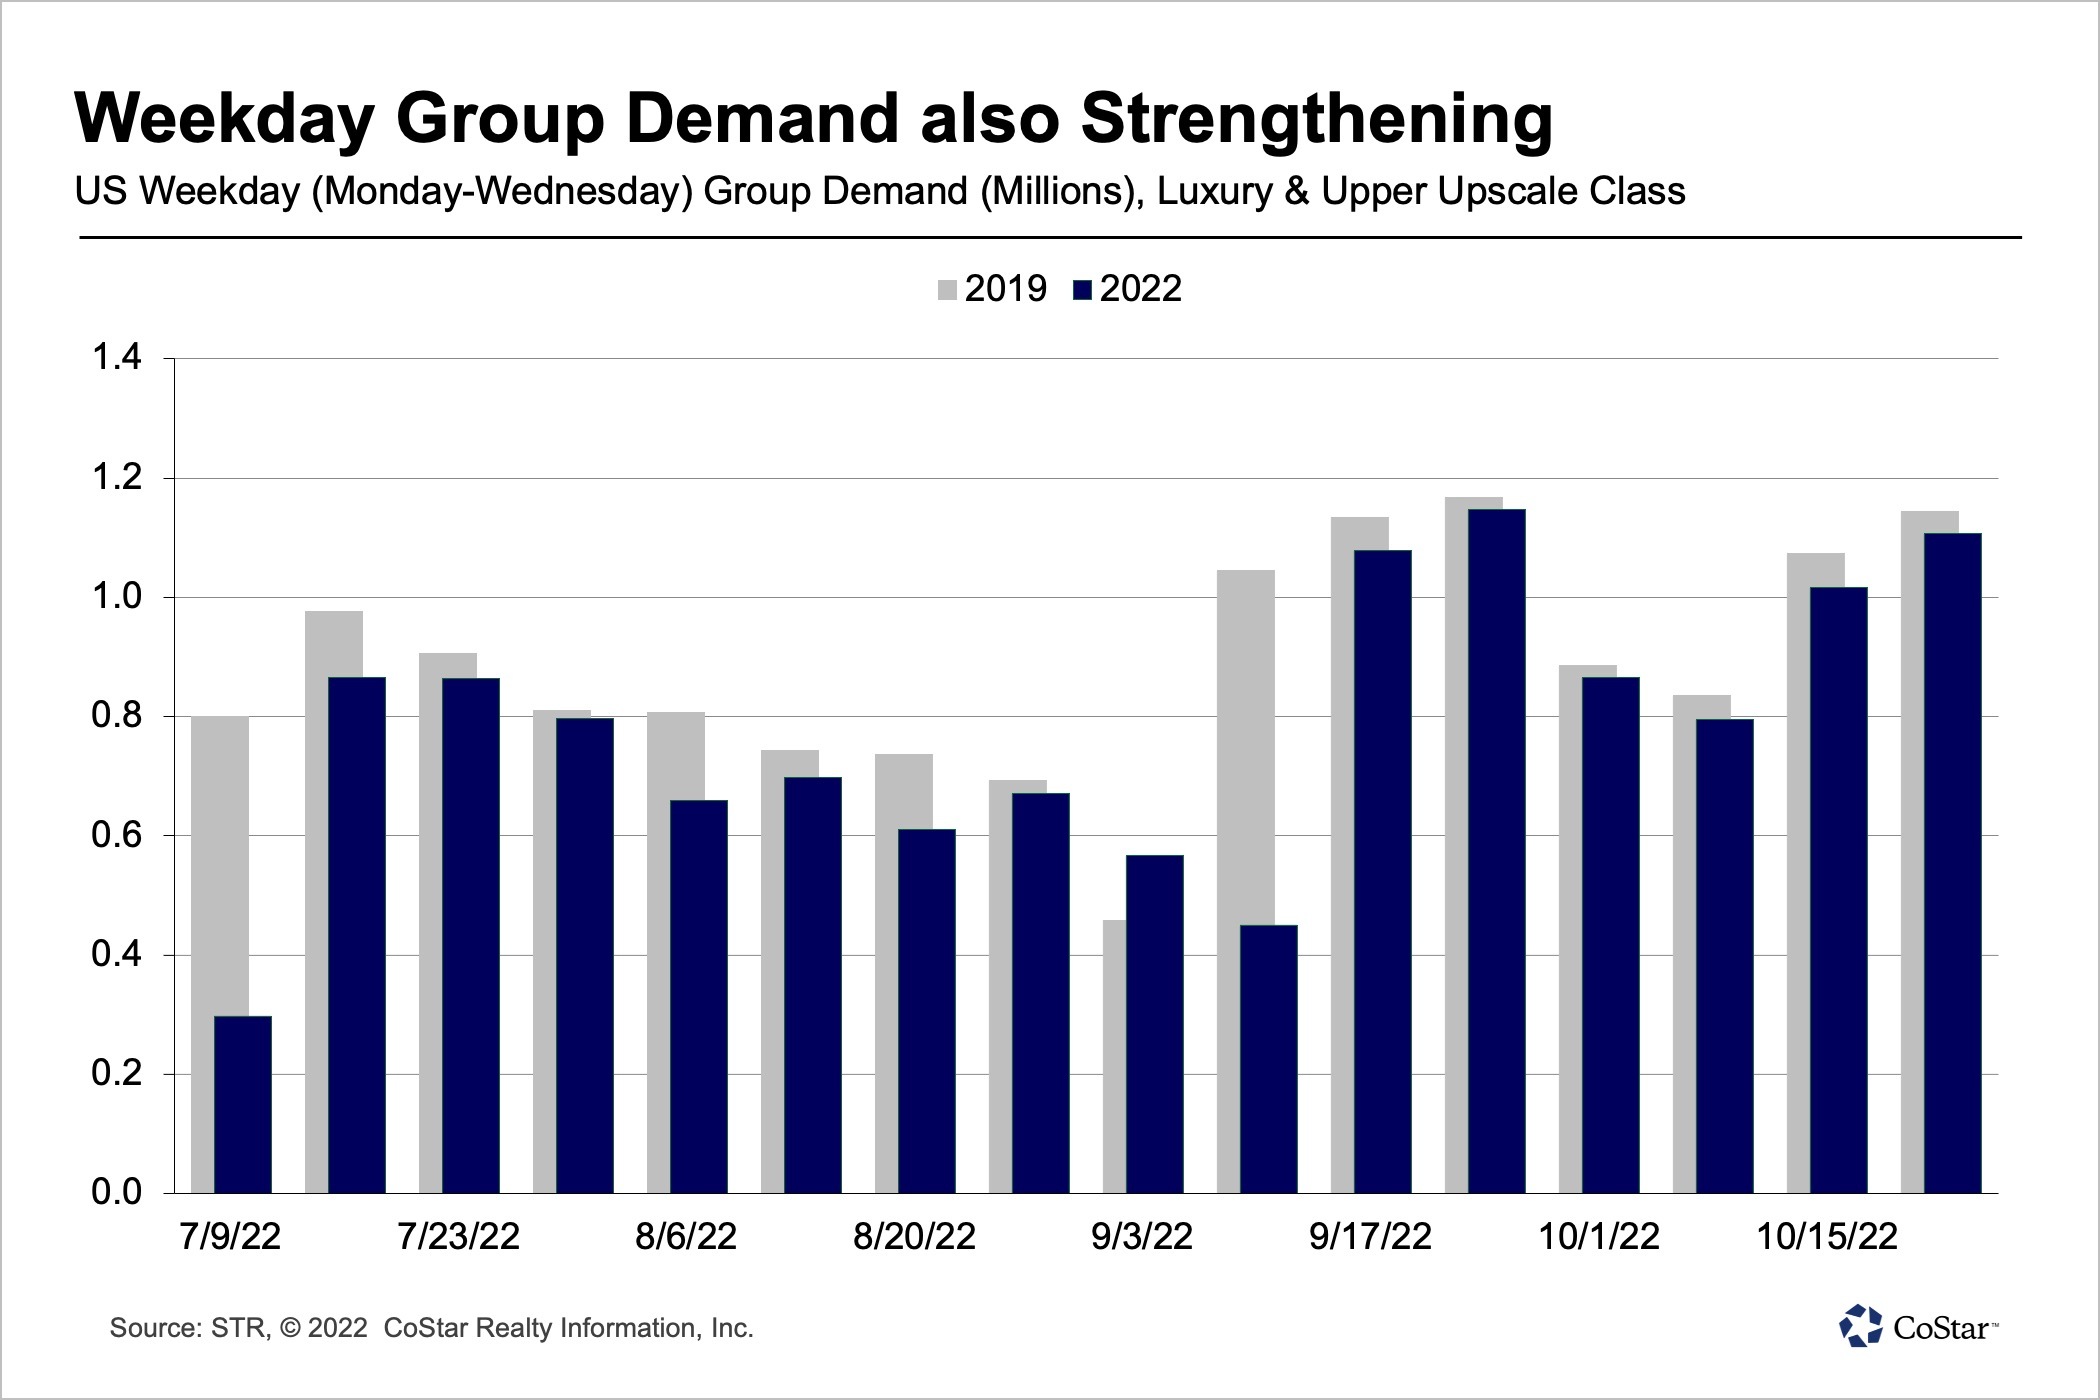
Demand for hotel rooms from groups was the second strongest since the start of the pandemic, helping to drive a week-over-week improvement in weekday hotel occupancy.
Monday to Wednesday occupancy across the U.S. increased in the week to 69.4%, up from 67.9% in the prior week. This was the highest weekday occupancy since late July.

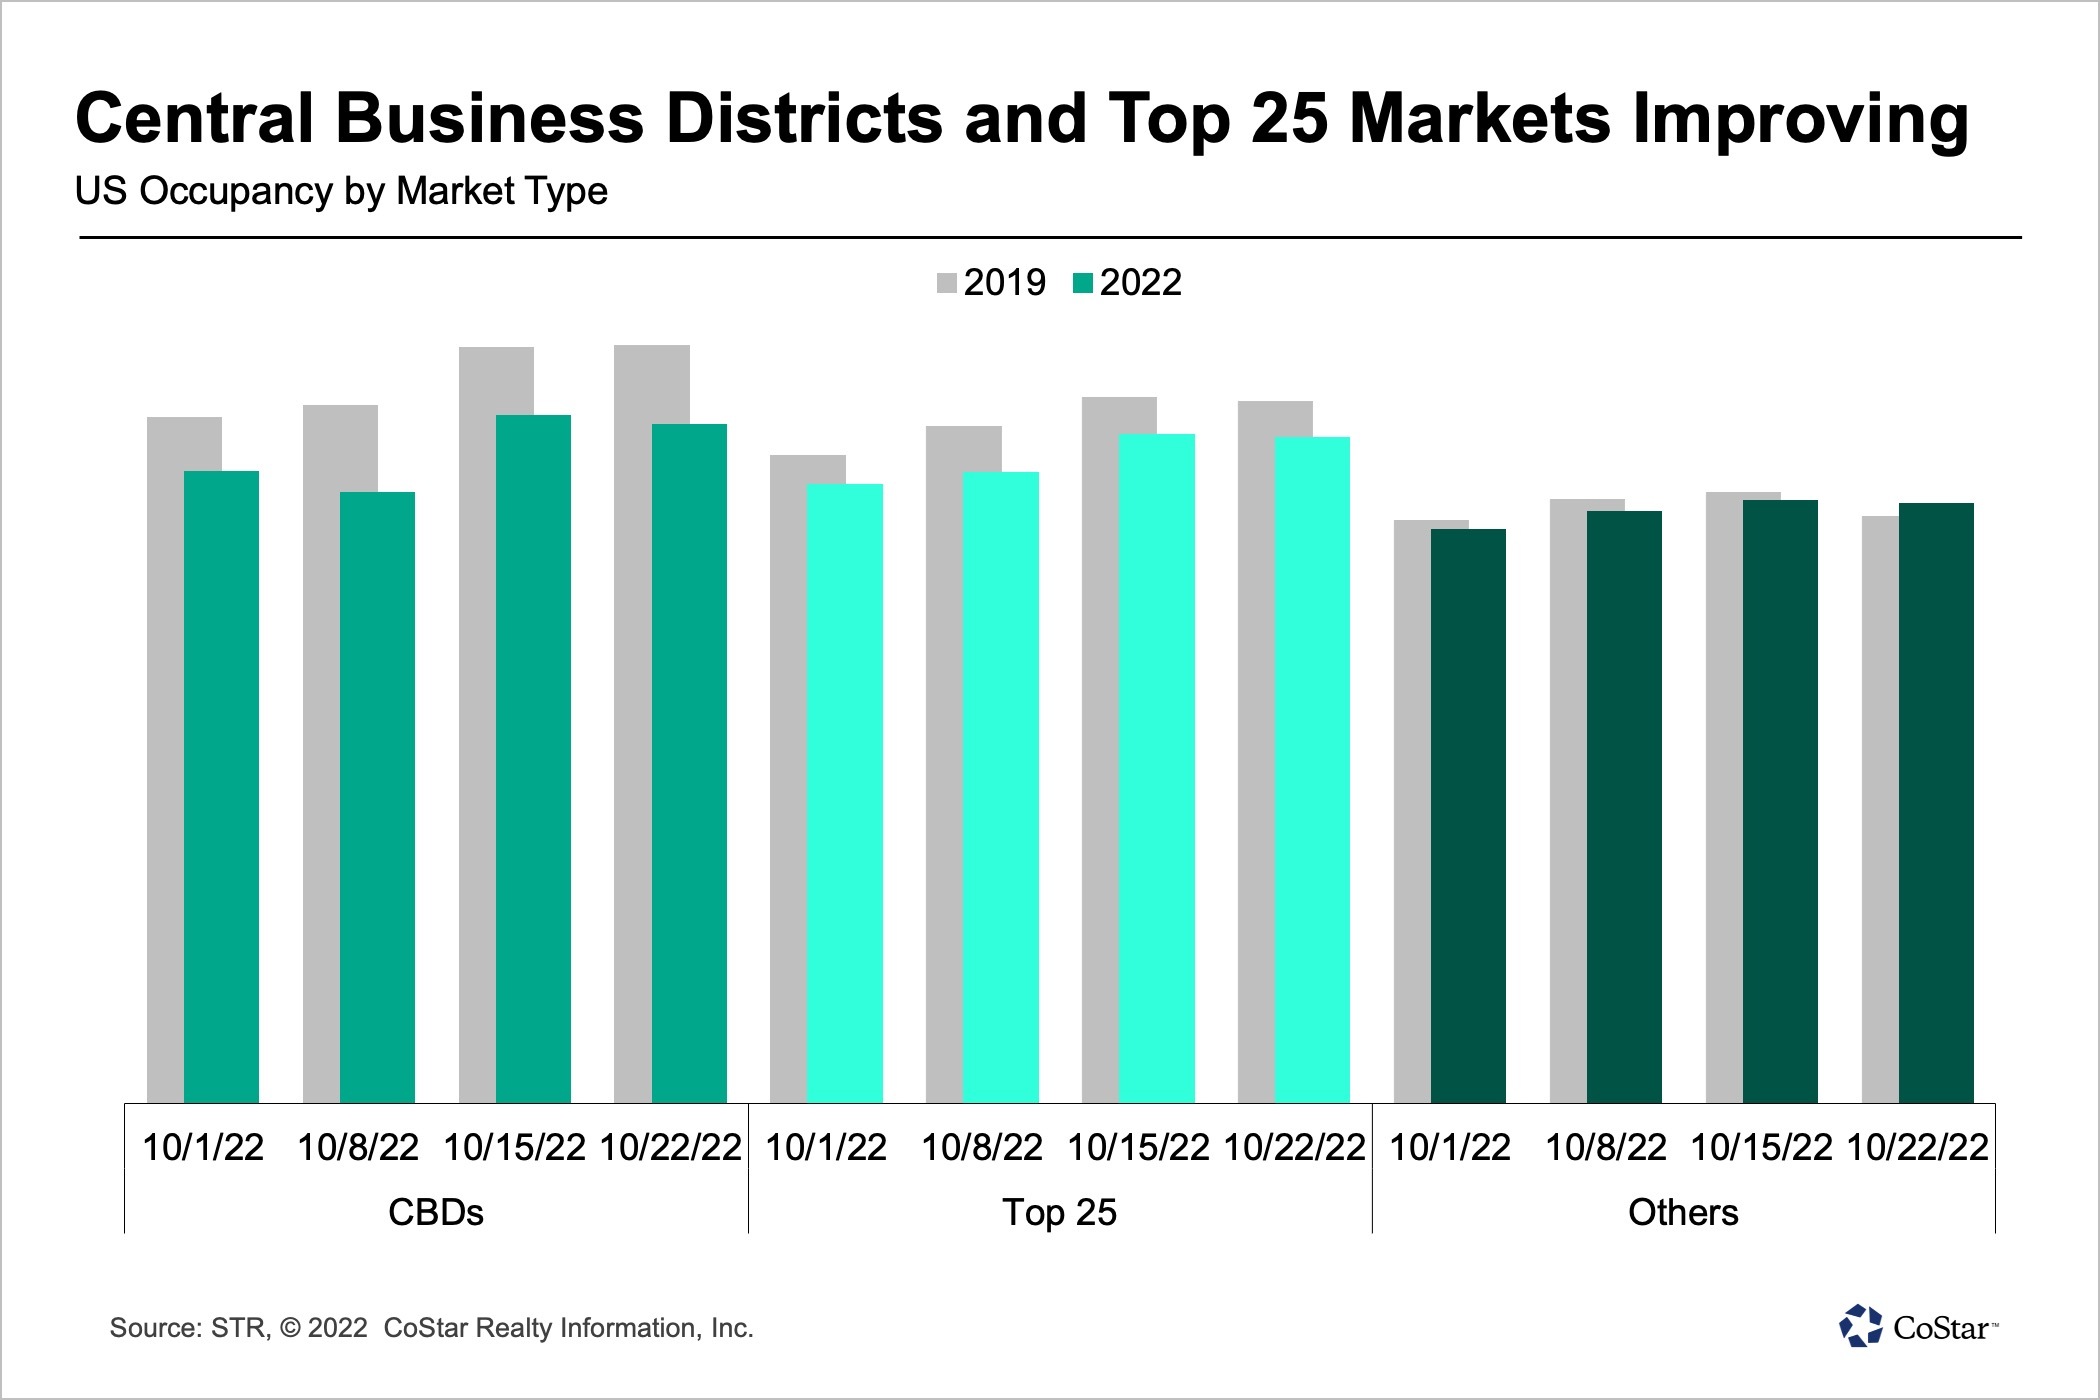
The top 25 markets did even better with occupancy increasing to 75.1%. New York led the nation in weekday occupancy at 90.7% followed by Boston at 86.8%. Most of the top 25 markets had weekday occupancy above 70%, with the lowest in Minneapolis at 60.7%.
Weekday occupancy in the top 25 markets was up 1.2 percentage points week over week, and outside of the top 25 markets was up 1.5 percentage points to 66.6%.
Central business districts also did very well with weekday occupancy rising to 77.3%. Central business district weekday occupancy has been above 75% in five of the past six weeks. Occupancy surpassed 90% in three of the 20 central business districts tracked weekly, led by Nashville and followed by Boston and the New York Financial District.
Weekday occupancy for large urban, luxury and upper-upscale hotels in the top 25 markets reached 80.6%, third highest since the start of the pandemic but nearly nine percentage points lower than in the same week of 2019. This is only the third time since the start of the pandemic that occupancy for these types of hotels has surpassed 80%, with the highest weekday occupancy of the pandemic era five weeks ago at 82%.
Occupancy in the top 25 markets surpassed 75% for a second consecutive week. A week prior, the group reported its highest occupancy since the start of the pandemic at 75.3%.

ADR in the top 25 remained above $190 for a second week with the weekday level above $193. Adjusted for inflation, top 25 ADR is nearing 2019 levels — just 3% lower.
Despite the solid performance, top 25 market occupancy over the past two weeks was down 4.1 percentage points versus 2019, and room demand also trailed 2019 as well as 2018 levels.
The weakness came from four of the largest markets in the country: Chicago, New York, San Francisco and Washington, D.C., where demand averaged 12% lower than in the same two weeks of 2019.
San Francisco had the largest demand deficit, down 19% versus 2019. However, nine of the top 25 markets had higher demand over this two-week period than in 2019 — including Atlanta, Boston, Miami, Nashville, Orlando and Phoenix. In total, top 25 demand was down 3% over the past two weeks versus 2019. And, while New York was still at a deficit, it had the nation’s highest occupancy this week at 88.6%.
Occupancy outside of the top 25 markets was 67.5% for the week ending Oct. 22 and was nearly flat over the past two weeks.
Weekend occupancy in the top 25 markets has also been stronger, surpassing 80% in the past three weeks. In Boston and New York, occupancy exceeded 90% this past weekend. The highest weekend occupancy was in Gatlinburg/Pigeon Forge, Tennessee, at 96%, followed by Madison, Wisconsin, at 93%. Austin reported its highest weekend occupancy of the year at 93.2% due to the Formula 1 race held there.
The highest occupancy outside of the top 25 markets was posted in areas affected by Hurricane Ian. Occupancy surpassed 86% in two Florida markets, Sarasota and Fort Myers. In Fort Myers, occupancy was up 3.9 percentage points from the previous week.
Pandemic-era occupancy records were also achieved at luxury and upper-upscale hotels, at 75.2% and 75.4%, respectively. Compared to the same week in 2019, occupancy for the two chain scales was more than five percentage points lower, but that gap to 2019 is trending down.
Upscale and upper-midscale hotels also reported occupancy above 70% for the week. The lowest weekly occupancy was in the economy chain scale at 61%.
Over the past 28 days, 89% of all U.S. hotel markets surpassed 2019 levels in nominal RevPAR. Adjusted for inflation, 53% of markets beat 2019 levels, led this week by Sarasota. Overall, top 25 real RevPAR was 8% lower than in 2019, with San Francisco at the bottom.
Only seven markets were still classified as being in “recession,” with inflation-adjusted RevPAR between 50% and 80% of 2019 levels.
Isaac Collazo is VP Analytics at STR.
This article represents an interpretation of data collected by CoStar's hospitality analytics firm, STR. Please feel free to contact an editor with any questions or concerns. For more analysis of STR data, visit the data insights blog on STR.com.
